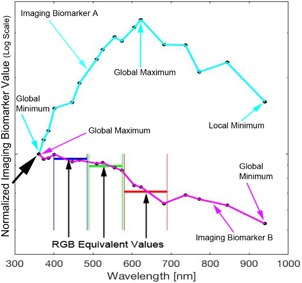
Figure 1.

This figure highlights two imaging biomarkers on one sample lesion. The two most diagnostic RGB melanoma imaging biomarkers (from our previous study 4) were evaluated on each hyperspectral gray scale image of a pigmented lesion. They illustrate two classes of hyperspectral imaging biomarkers where the trend is either (A) the maximum is within the spectral range or (B) a constant decrease with a maximum in the ultraviolet (UV) and minimum in the infrared (IR). The data show that hyperspectral melanoma imaging biomarkers can be evaluated at a wavelength where they have values outside the visible (RGB) values (illustrated for imaging biomarker B in magenta).
