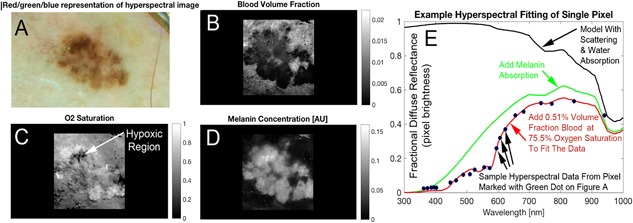
Figure 3.

Hyperspectral melanoma imaging biomarkers were derived from spectral analysis (e.g., blood distribution and oxygenation). RGB image (A) shows a visual representative sampling of the hyperspectral image. The correlating blood volume fraction (B), oxygen saturation (C) and melanin factor (D) maps are produced by fitting the spectrum at each pixel. The absorption effect of melanin is added to attenuate the spectrum as shown (green). The final added absorber in our diffuse reflectance spectral simulation is hemoglobin, which we added a reasonable volume fraction and oxygen saturation. The values shown in red text are spectral oximetry biomarkers which are shown as solved for in one pixel of the image but are available in the whole lateral field of view (i.e., at any pixel). These maps, which demonstrate the type of image data hyperspectral melanoma imaging biomarkers are to be derived from, are created by fitting the spectrum (E) produced by the investigational device at each pixel. The spectrum shown (E) is a single pixel in the image (shown in green in A), evaluated across the 21 colors of the LEDs in the hyperspectral camera.
