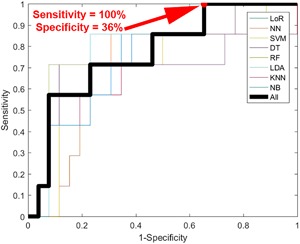
Figure 4.

Receiver operator characteristic (ROC) curve for melanoma detection in hyperspectral images. Thin lines represent the individual machine learning approaches used while the thick line represents the “wisdom of the crowds” diagnostic that averaged the risk scores produced by the individual machine learning approaches.
