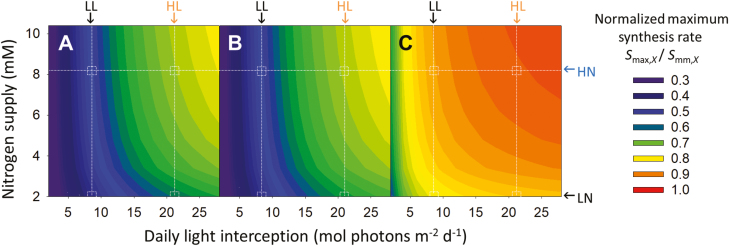
Fig. 1.
Simulated effects of daily light interception (ILd, mol photons m−2 d−1) and nitrogen supply level in the nutrient solution (NS, mM) on maximum protein synthesis rate (Smax,X) in Eq. (7) using coefficients from Table 1, of (A) the carboxylation, (B) the electron transport and (C) the light harvesting pools. The colors denote the normalized maximum protein synthesis rate, which is Smax,X normalized by the potential maximum protein synthesis rate (Smm,X) in Eq. (7). The data obtained in the growth chamber experiment were used for the parameterization. The arrows above and beside the figures indicate the corresponding average environmental conditions in the greenhouse experiment: high light (HL) 21.4 mol photons m−2 d−1; low light (LL) 8.5 mol photons m−2 d−1; high nitrogen (HN) 8.2 mM; low nitrogen (LN) 2.0 mM.

