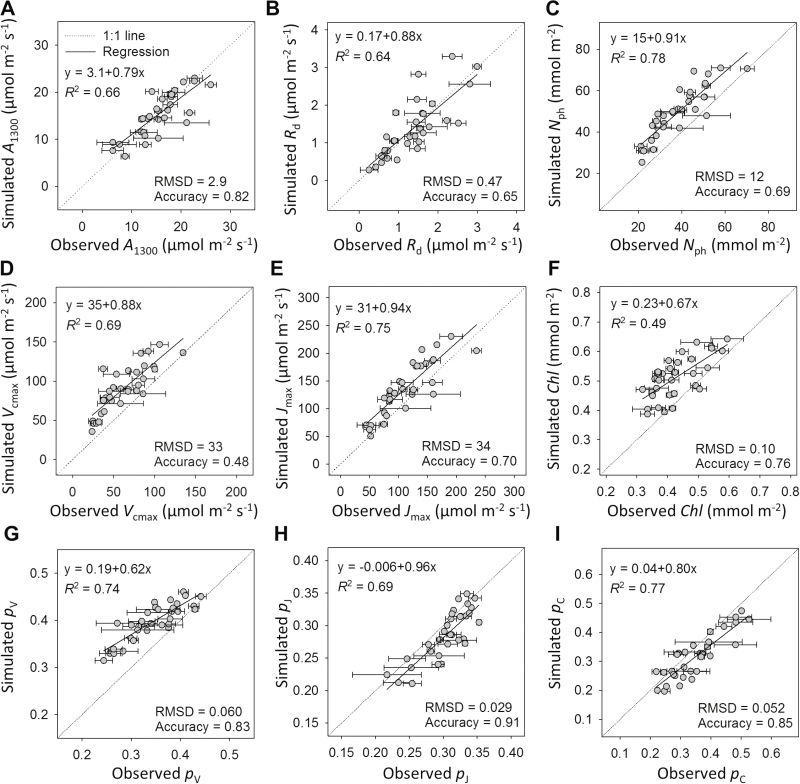
Fig. 2.
Comparisons between simulated and observed leaf photosynthetic parameters. (A) Light-saturated net photosynthetic rate under PPFD 1300 µmol photons m−2 s−1 (A1300, µmol CO2 m−2 s−1); (B) daytime respiration rate (Rd, µmol CO2 m−2 s−1); (C) leaf photosynthetic nitrogen (Nph, mmol N m−2); (D) maximum carboxylation rate (Vcmax, µmol CO2 m−2 s−1); (E) maximum electron transport rate (Jmax, µmol e− m−2 s−1); (F) chlorophyll (Chl, mmol Chl m−2); (G) partitioning fraction of the carboxylation pool (pV); (H) partitioning fraction of the electron transport pool (pJ); and (I) partitioning fraction of the light harvesting pool (pC). The observed data were obtained in the greenhouse experiment. The dotted grey lines are one-to-one lines. Root mean squared deviation (RMSD) and accuracy of the predictions are shown (see Materials and methods).

