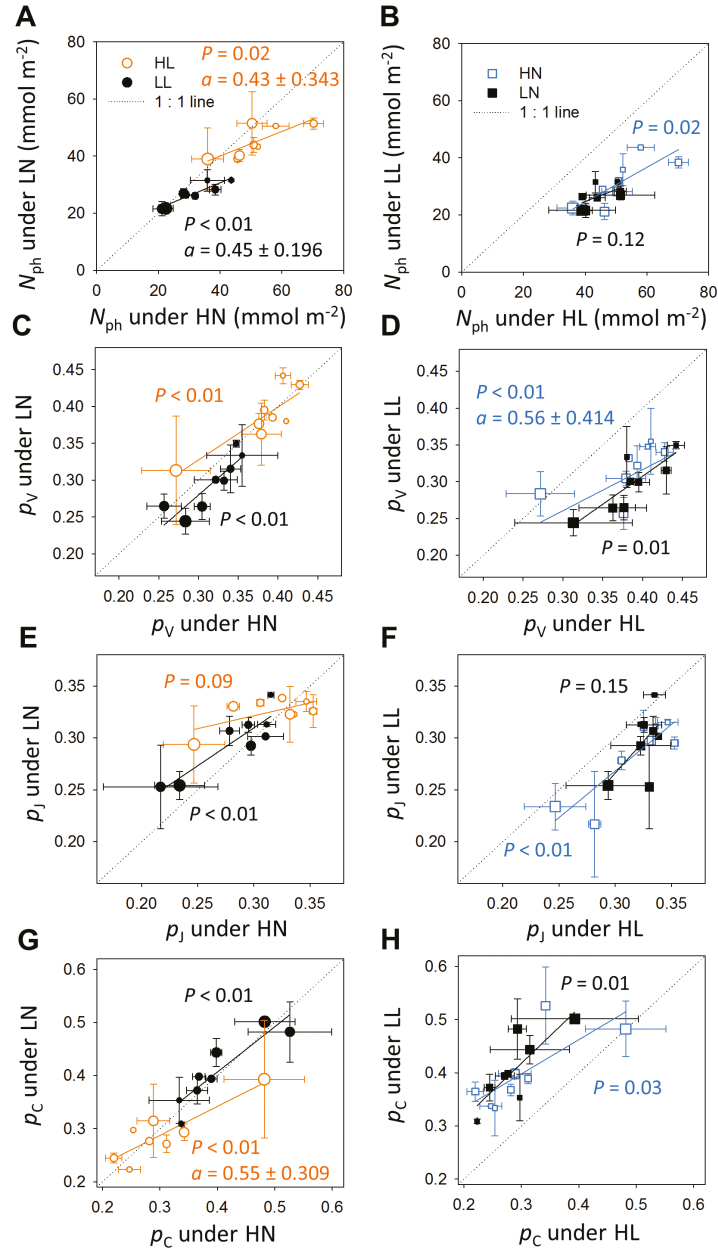
Fig. 3.
Comparisons of leaf photosynthetic nitrogen (Nph, mmol N m−2; A, B), partitioning fractions of the carboxylation pool (pV; C, D), the electron transport pool (pJ; E, F), and the light harvesting pool (pC; G, H) between high and low nitrogen supply (HN and LN, respectively; A, C, E, G) and between high and low light conditions (HL and LL, respectively; B, D, F, H). Each point represents the measurements in the greenhouse experiment obtained from a comparable canopy layer. The orange open circles indicate leaves grown under HL, the black closed circles indicate LL, the blue open squares indicate HN and the black closed squares indicate LN. The size of the circles increases with leaf age, ranging from 77 °Cd to 414 °Cd. The solid lines show the linear regression y=ax + b. The P values of the slope a are shown. The values of a are specified with 95% confidence intervals when they are significantly different from 1. The dotted grey lines are one-to-one lines.

