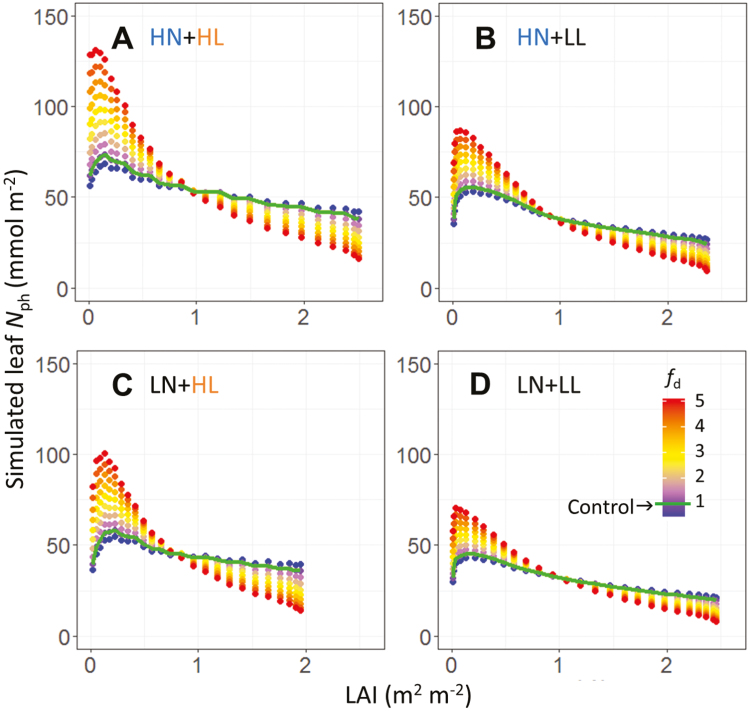
Fig. 4.
Leaf photosynthetic nitrogen (Nph, mmol N m−2) distributions along the canopy depth, characterized by leaf area index (LAI, m2 m−2). Variations in nitrogen distribution were created using a distribution factor fd ranging from 0.5 to 5.0 at intervals of 0.5 in Eq. (18) under different growth conditions. (A) High nitrogen and high light (HN+HL); (B) high nitrogen and low light (HN+LL); (C) low nitrogen and high light (LN+HL); (D) low nitrogen and low light (LN+LL). Simulated control Nph distributions (fd=1) are indicated by the green lines.

