Fig. 2.
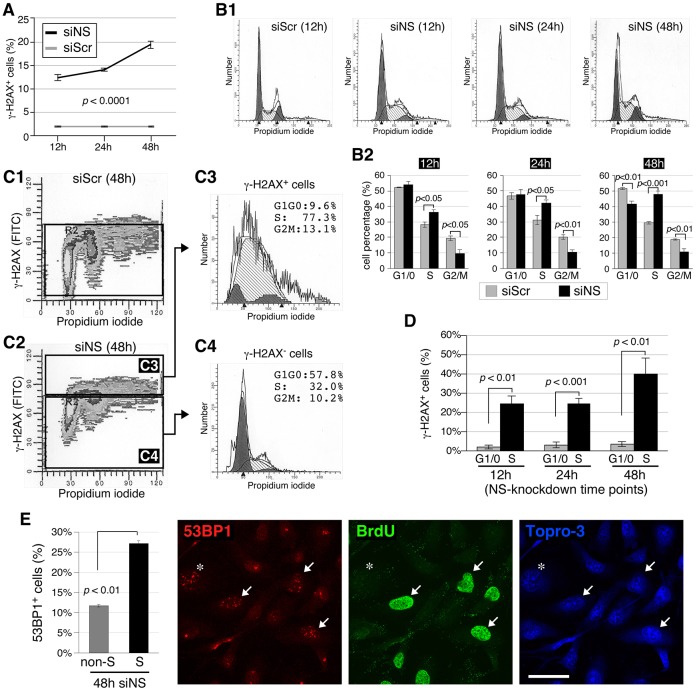
S-phase DNA damage is an early event during knockdown of nucleostemin. (A) FACS-based quantification of the percentage of γ-H2AX+ cells in MDA-MB-231 cell samples treated with siScr or siNS (100 nM) for 12, 24 or 48 hours. Data show the mean±s.e.m. (B) Cell-cycle profiles (B1) and quantitative analyses (n = 4, B2) of siScr- and siNS-treated MDA-MB-231 cells at different knockdown time-points. The fitted profiles shaded in gray represent cells with more than 2N copies of chromosomes. (C) Cell-cycle profiles of the γ-H2AX+ versus γ-H2AX− cells in nucleostemin-knockdown samples were quantitatively analyzed by using FACS with anti-γ-H2AX and propidium iodide (PI). (D) Based on the analyses shown in C, the percentages of γ-H2AX+ cells in S-phase versus G1/G0-phase in the nucleostemin-knockdown sample were compared at the 12, 24 and 48-hour time-points. Data show the mean±s.e.m. (E) Immunofluorescent imaging (right) using anti-53BP1 and anti-BrdU antibodies in MDA-MB-231 cells treated with siNS (100 nM) for 48 hours. Quantitative data (left) represent the mean±s.e.m. of the percentage of 53BP1+ cells in the non-BrdU-labeled (non-S-phase, asterisk) versus BrdU-labeled (S-phase, arrows) cell populations. Scale bar: 50 µm.

