Fig. 6.
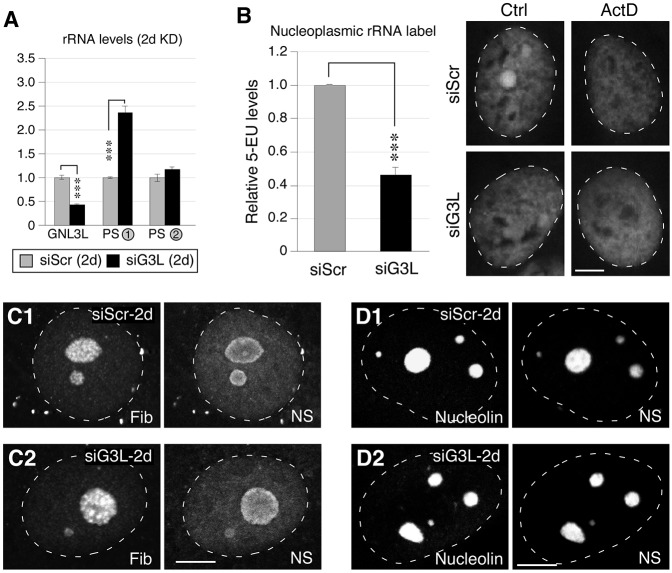
Loss of GNL3L perturbs the processing of pre-rRNAs. (A) qRT-PCR assays of GNL3L, PS-1 and PS-2 levels in MDA-MB-231 cells treated with siScr or siG3L for 2 days (2d). The expression levels of target transcripts were quantified by normalizing to the expression of HMG-14. The expression levels of each transcript in the siScr samples were arbitrarily set as 1. (B) The differential 5-EU signals [control (Ctrl) minus actinomycin (ActD)-treated samples] in the nucleoplasm were quantified in MDA-MB-231 cells treated with siScr or siG3L for 2 days (left). Right, immunofluorescence of 5-EU signals in control (siScr) and GNL3L-knockdown (siG3L) cells with (ActD) or without (Ctrl) treatment with a low dose of ActD. Data show the mean±s.e.m. ***P<0.0001. (C) Confocal immunofluorescence to show the fibrillarin (Fib)- and nucleostemin (NS)-labeled structures in cells treated with siScr or siG3L for 2 days. (D) Confocal immunofluorescence of the nucleolin- and nucleostemin-labeled structures in cells treated with siScr or siG3L for 2 days. White dashed lines show nucleus outlines. Scale bars: 10 um.

