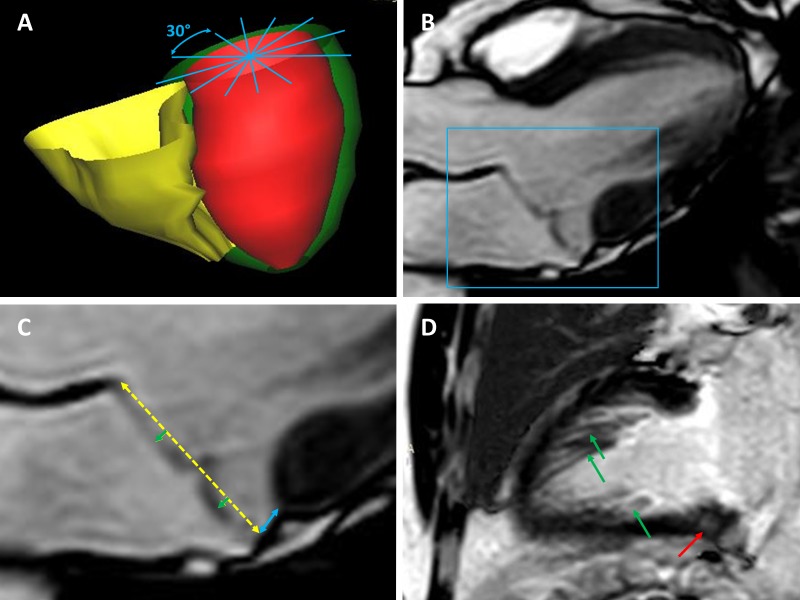
Figure 1.
Cardiac magnetic resonance measurements. (A) Six long-axis images were obtained, with a 30˚ angulation between each plane, as indicated by the blue lines. (B) Three-chamber view of a patient with mitral annulus disjunction (MAD), with prolapse of the mitral valve leaflets. (C) Zoom of (B): the yellow-dotted line represents the mitral annulus. The blue line represents the longitudinal MAD. This image shows the presence of prolapsing mitral leaflets, indicated by the two green arrows. (D) Late gadolinium enhancement on the basal left ventricular wall (red arrow) and the papillary muscles (green arrows).

