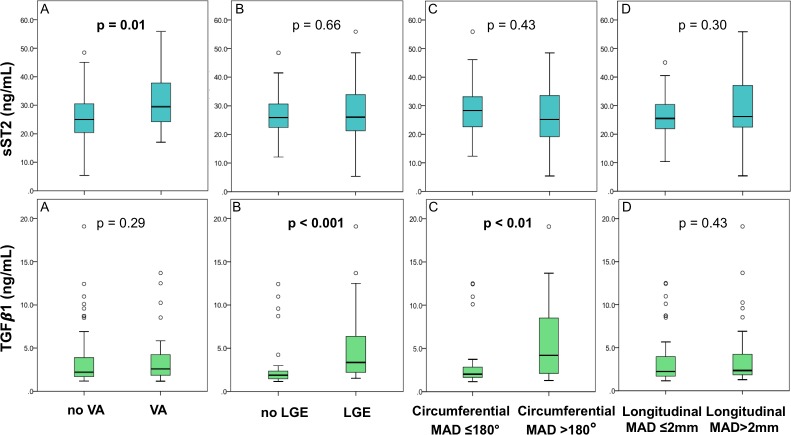
Figure 3.
Boxplots representing soluble suppression of tumourigenicity-2 (sST2) levels in the upper row and transforming growth factor-β1 (TGFβ1) levels in the lower row. (A) No severe ventricular arrhythmia (VA) versus severe VA. (B) No late gadolinium enhancement (LGE) present on cardiac magnetic resonance (CMR) versus LGE present on CMR. (C) Circumferential mitral annulus disjunction (MAD) ≤180° versus circumferential MAD >180°. (D) Longitudinal MAD on the three-chamber view ≤2 mm versus longitudinal MAD on the three-chamber view >2 mm. P values were obtained by performing Student’s t-test for sST2 and Mann-Whitney U test for TGFβ1.

