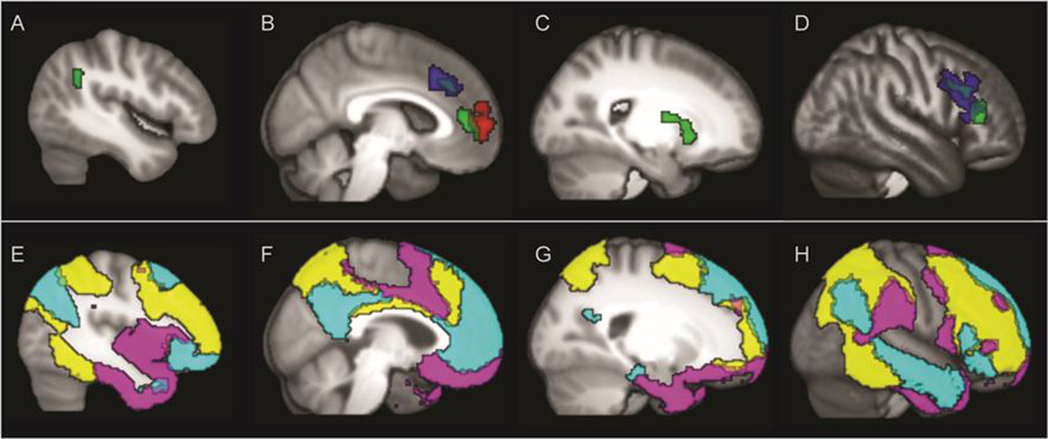
Figure 1.
Top Panel: The seed by cluster effects for the typically developing comparison subjects in panels A (left lateral), B (left medial), C (Right Putamen) and D (right inferior and middle frontal. Blue = increasing connectivity with default mode network (DMN) seeds with age. Red = decreasing connectivity with age to salience emotional network (SEN) seeds. Green = increasing connectivity with age in healthy controls for cognitive control network (CCN) seeds. Bottom Panels E through H illustrate the three primary network masks, DMN (cyan), SEN (violet), and CCN (yellow) in the same laterality of panels to match Panels A through D for easy comparison of within and across network connectivity comparisons.

