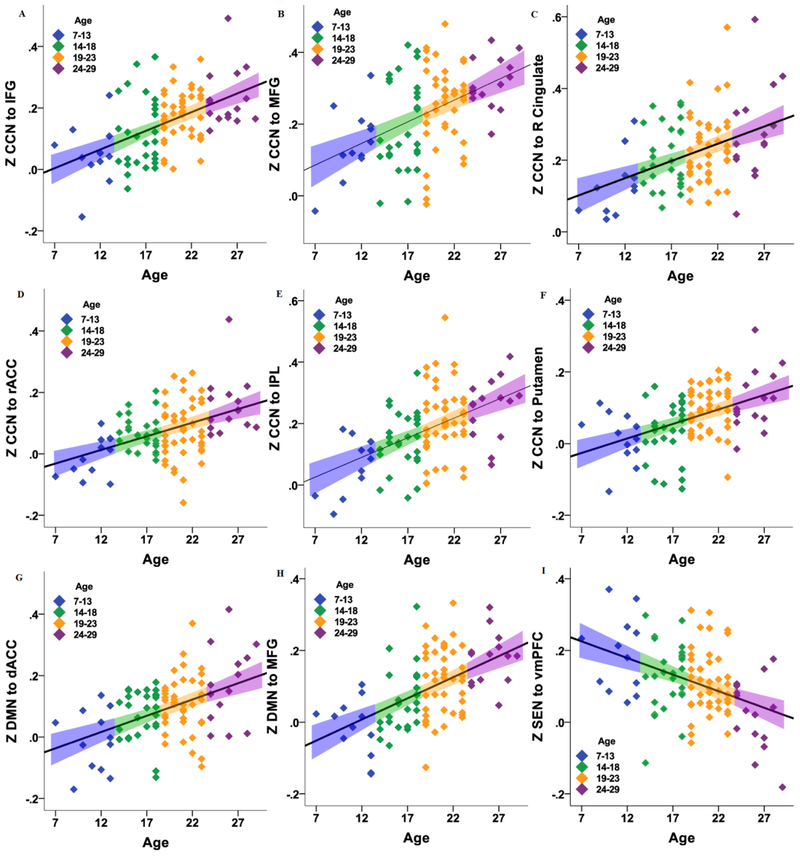
Figure 2.
Scatter plots of the relation between age (continuous) and mean Z-corrected connectivity between a) cognitive control network (CCN) with inferior frontal gyrus (IFG); b) CCN with middle frontal gyrus (MFG); c) CCN with right cingulate; d) CCN with rostral anterior cingulate cortex (rACC); e) CCN with inferior parietal lobule (IPL); f) CCN with putamen; g) default mode network (DMN) with dorsal ACC (dACC); h) DMN with MFG; i) salience emotional network (SEN) with ventromedial prefrontal cortex (vmPFC). The colors represent the age ranges for illustrative purposes, and the linear error bar is the 95% confidence interval for the mean.

