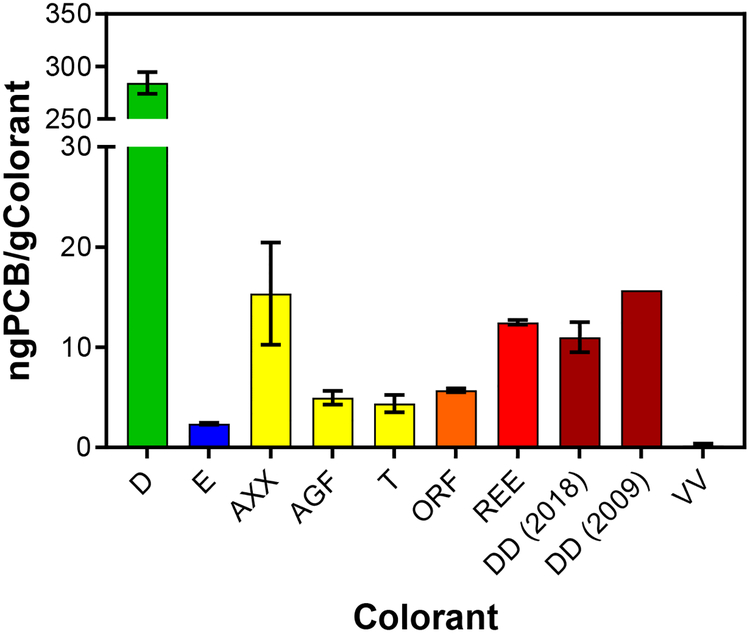
Figure 1.
Concentration of PCBs found in colorants. The color of the bar indicates the color we observed when extracting each colorant. AXX, T, and AGF are all yellow. Error bars are one standard deviation from the average. No standard deviation was reported for DD in 2009.28

