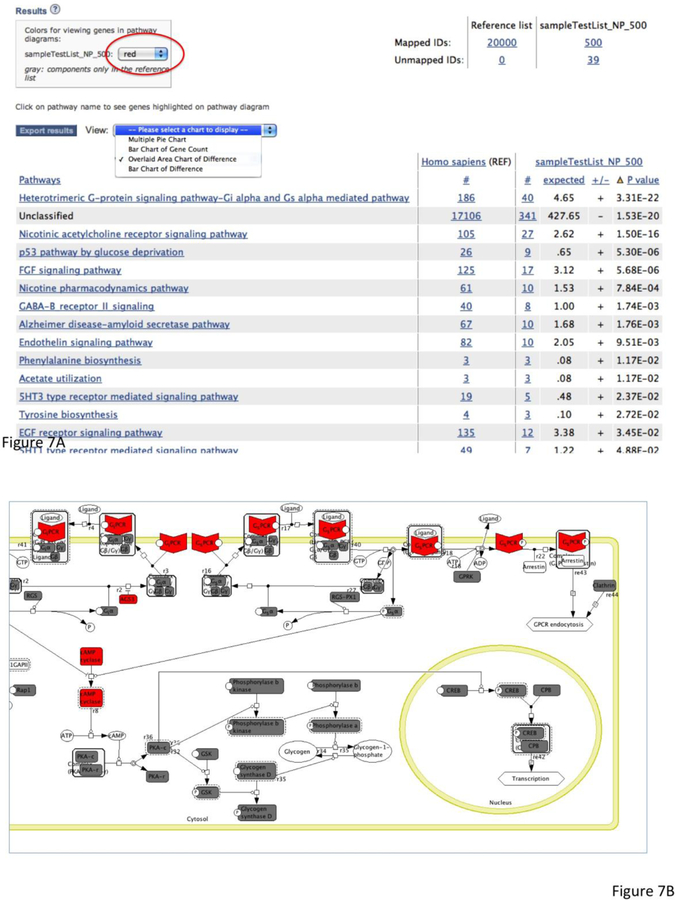
Figure 7. Result from the statistical overrepresentation test. The results are based on the sampleTestList_NP_500 file in the Supplemental Materials.
(A) The summary of the results is displayed in a table. You can export the table in a tab-delimited file by clicking the Export results button. You can also view the results in other views by using the View drop-down menu. If your analysis is done in pathway as shown here, you can click the pathway name and display the pathway diagram. The pathway components that have genes in your test list will be highlighted. The color of the highlighted component can be defined at the top of the page (red circle). A total of 4 test lists can be analyzed and viewed at the same time.
(B) The results viewed in the PANTHER pathway Heterotrimeric G-protein signaling pathway – Gi alpha and Gs alpha mediated pathway (P00026). The components that contain the genes in the test gene list are highlighted in red.

