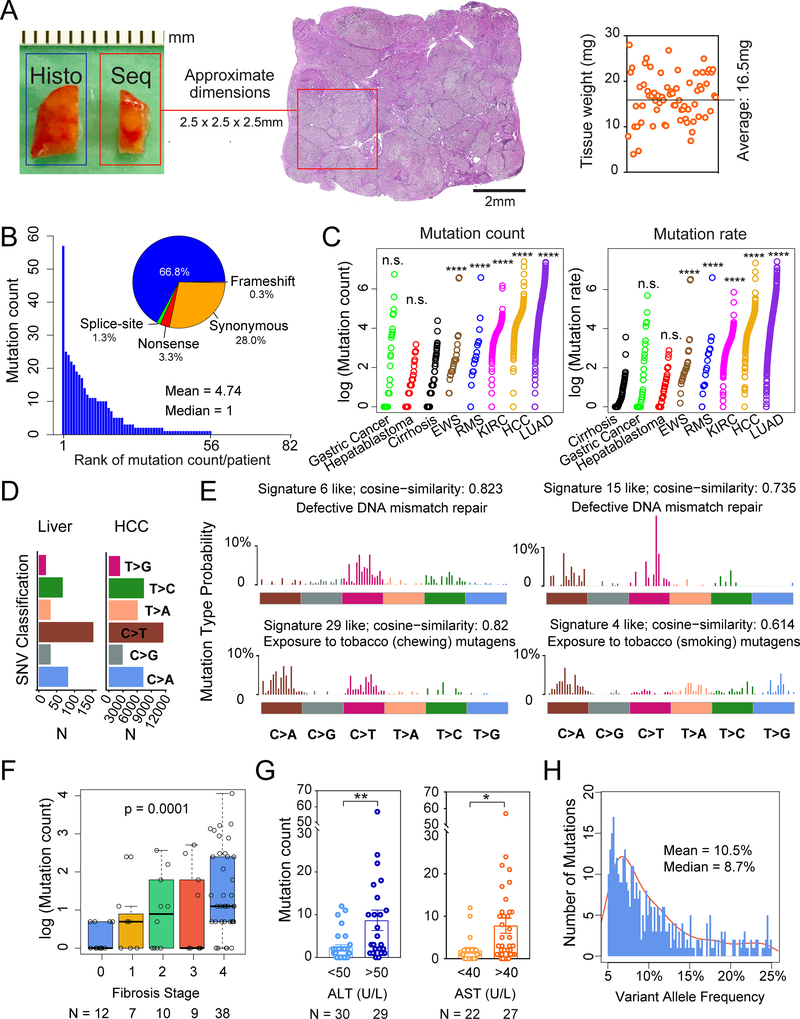
Figure 1. Whole exome sequencing reveals mutational burden within diseased livers.
A. Schema for liver tissue sampling. Fresh frozen non-malignant liver tissues from HCC surgical resections or livers removed during transplant surgeries were obtained for genomic DNA. The adjacent tissue was sectioned for histology. Sequenced tissue weights are shown on the right.
B. Number of mutations found in each patient sample. Classifications in the pie chart: among 389 total mutations, 260 are missense, 13 are nonsense, 4 are splice-site, 1 is a frameshift deletion and 111 are synonymous mutations.
C. Mutation count and rate in liver samples compared with cancer types. Mutation count equals the absolute number of mutations per patient sample with VAF > 5%. Mutation rate equals the sums of 2 times the VAFs for each mutation. The Wilcoxon Rank-Sum Test was used to compare mutation counts and rates between tissue types.
D. Classes of missense mutations or SNVs in liver tissues and HCC samples from TCGA.
E. The 4 mutation signatures with the highest cosine similarity are shown.
F. Correlation between mutation count and fibrosis stage. The p-value is calculated based on the one-way Jonckheere trend test.
G. Correlation between mutation count and ALT or AST, which are serum markers of hepatic damage.
H. VAF distribution for whole exome data. Mean VAF is 10.5% (+/− 0.514% SEM, with 95% confidence interval) and median VAF is 8.7%.
All data are presented as mean ± SEM. *, p<0.05, **, p<0.01,***, p<0.001,****, p<0.0001.

