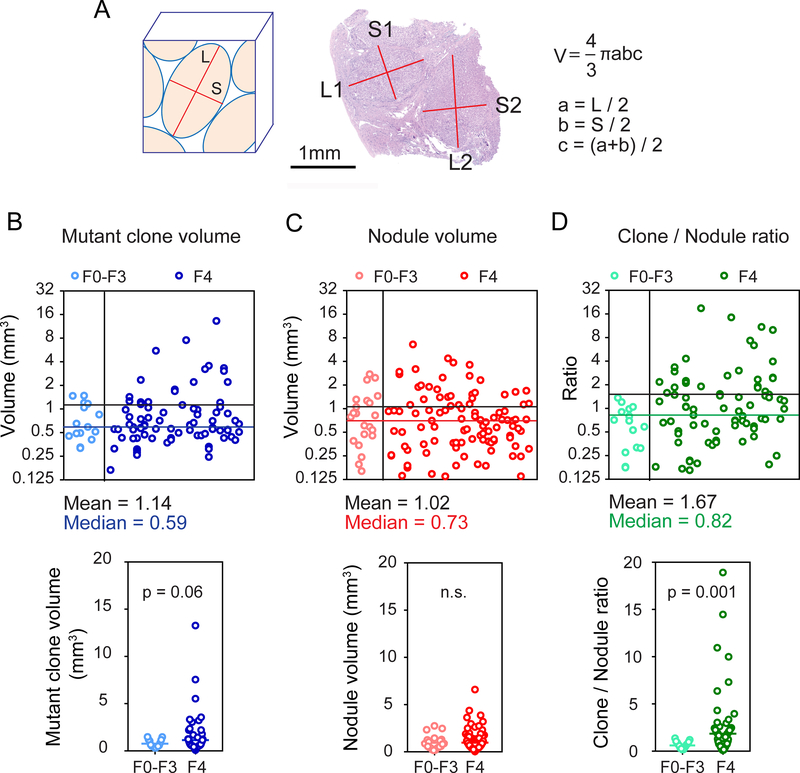
Figure 3. A comparison of mutant clone and nodule volumes indicates clonal expansion with increasing liver fibrosis.
A. The formula for nodule volume calculations based on measured nodule dimensions.
B. Individual mutant clone volumes calculated from ultra-deep sequencing VAFs (upper). Mutant clone volumes from F0–3 and F4 livers were compared (lower). There are 15 clones in F0–3 and 85 clones in F4 samples and each clone is represented by a blue circle.
C. Individual nodule volumes calculated using the measurements obtained in Figure 3A (upper). Nodule volumes from F0–3 and F4 livers were compared (lower). We measured 22 nodules in 11 F0–3 samples and 100 nodules in 53 F4 samples. Each nodule is a red circle.
D. Ratios of individual mutant clone volumes / average nodule volume of each sample (upper). The ratios from F0–3 and F4 livers were compared (lower). Each ratio is a green circle.

