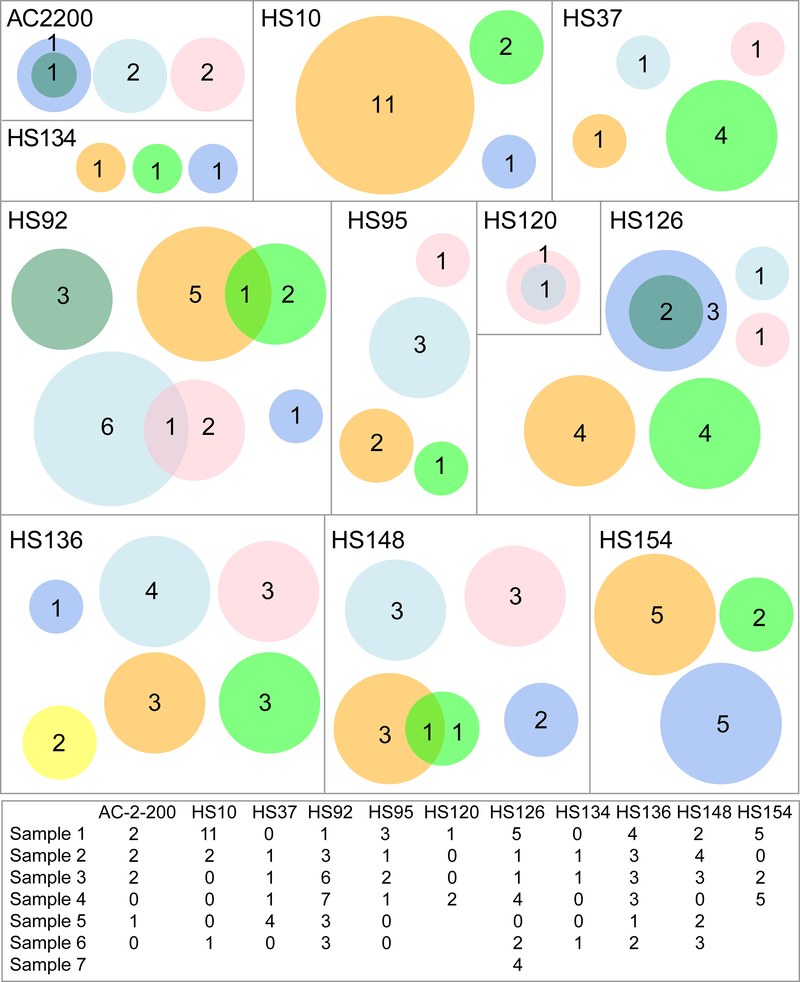
Figure 4. Venn diagrams representing livers sequenced at multiple locations.
In these diagrams, each box represents one patient, each circle represents one piece of liver, and each number represents the mutation count within a piece. Intersecting circles depict mutations that are shared. Circle size scales with mutation number, not tissue size. A table of mutation counts per piece of liver is at the bottom.

