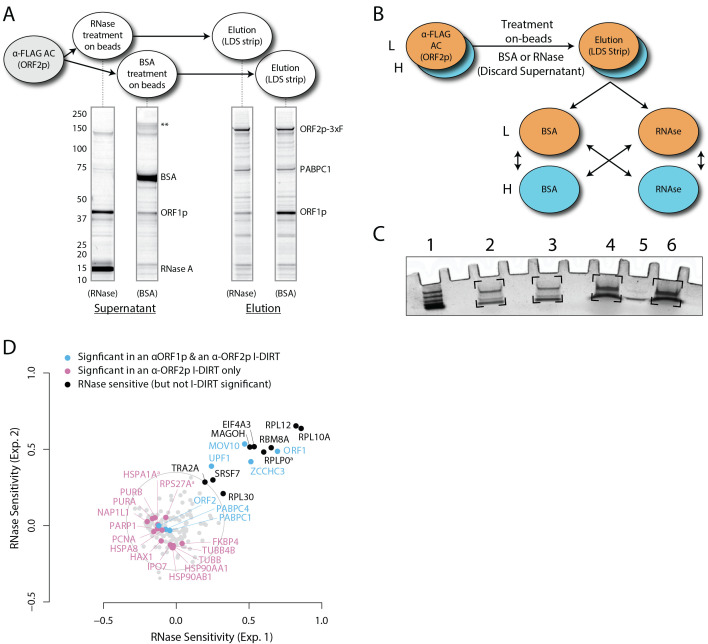
Figure 4. RNase sensitivity affinity capture.
(modified from Taylor et al., 2018 ). A. Coomassie Blue G-250 stained SDS-polyacrylamide gel displaying the profiles of the RNase- or BSA-treated affinity immobilized fractions. This kind of gel would be run during preliminary studies of RNase (or other enzyme) treatments. Major changes can be observed visually. If the identities of bands visually observed change upon RNase treatment are not know, they may be cut from e.g., the RNase supernatant lane (far left) and BSA elution lane (far right) and analyzed by mass spectrometry. More, subtle potential differences may be monitored by Western blotting. B. Mixing scheme for light and heavy SILAC-labeled fractions, as described in Step D1. C. Example image of Coomassie Blue G-250 stained gel plugs resulting from Step D5. Brackets indicate the gel areas excised and prepared for analysis. (1) Molecular mass marker. (2) Light-treated with Heavy-treated (RNaselight -with- RNaseheavy). (3) Light-untreated with Heavy-untreated (BSAlight -with- BSAheavy). (4) Light-treated with Heavy-untreated (RNaselight -with- BSAheavy). (5) BSA–200 ng. (6) Light-untreated with Heavy-treated (BSAlight -with- RNaseheavy). D. Processed data displaying the degree of RNase-sensitivity (i.e., differential affinity immobilization) exhibited by constituents of the SILAC-labeled fractions. Proteins requiring intact RNA to maintain stable interactions with immobilized ORF2p were released from the RNase-treated medium, while the BSA-treated sample controlled for the spontaneous release of proteins from the medium. Results from the assay have been graphed as the fraction of each detected protein present in the BSA-treated sample (RNase-sensitive proteins are more present in the BSA treated sample), normalized as described in step 2 (Data analysis). A cut-off of P = 10-3 for RNase-sensitivity is indicated by a light gray circle; proteins that are RNase-sensitive with a statistical significance of P < 10-3 are outside the circle. Proteins previously ranked significant by I-DIRT analysis ( Taylor et al., 2013 ) are labeled and displayed in blue or magenta (as indicated); black nodes were RNase-sensitive but not significant by I-DIRT; gray, unlabeled nodes were neither RNase-sensitive nor significant by I-DIRT.

