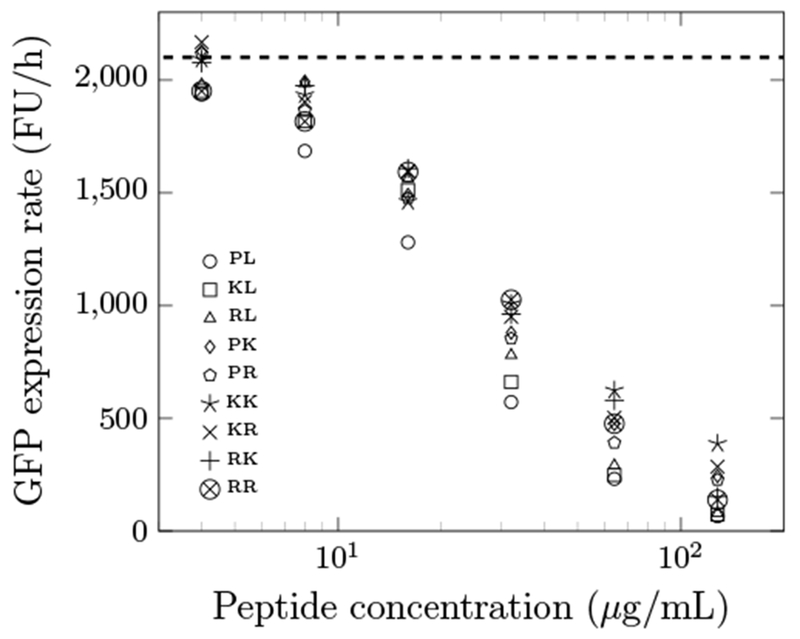
Fig. 4.

GFP expression rate of the optimized peptides at different concentrations. FU/h indicates relative fluorescence units per hour, which was computed as the slope of the fluorescence signal versus time. The dashed line is the negative control without any AMPs. The data are the average from a triplicate. The average standard deviation is 13% of the average. The maximum standard deviation is 24% of the average. The first and second letters of the legend indicate residues at position 4 and 7, respectively.
