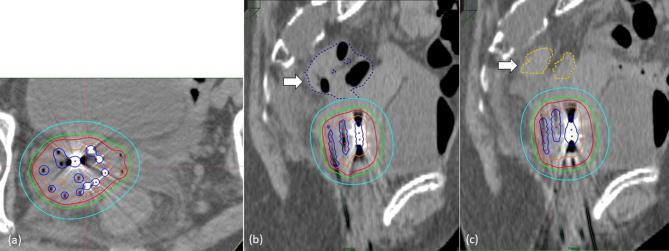
Figure 3.
Isodose distribution of the interstitial implant. (a) demonstrates an axial view of the tumor with the red and blue line representing the 100 and 200% isodose, respectively. (b, c) depict a sagittal view before and after artificial ascites injection. It is clear that the distance between sigmoid colon and high-dose volumes is increased after artificial ascites injection.

