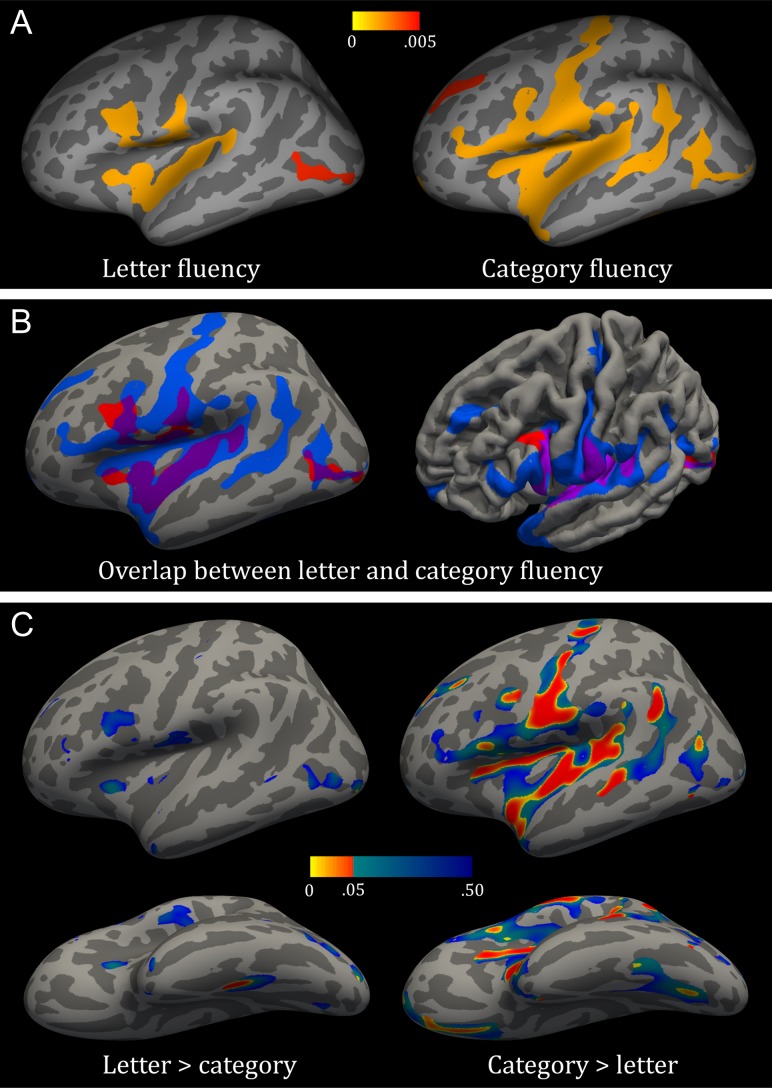
Figure 1.
The relation between cortical thickness and verbal fluency conditions. (A) Patterns of thickness related to letter fluency (left) and category fluency (right); color-scale bar represents P values. (B) Overlap in regions associated with letter (red) versus category fluency (blue) on an inflated surface (left) and tilted pial surface to highlight the dissociation in the inferior frontal gyrus from a light anterior-dorsal angle (right) (C) Statistically stronger correlation with cortical thickness for letter than category fluency (left) and category than letter fluency (right) in lateral (top) and ventral (bottom) views; color-scale bar represents P values.

