Figure 1:
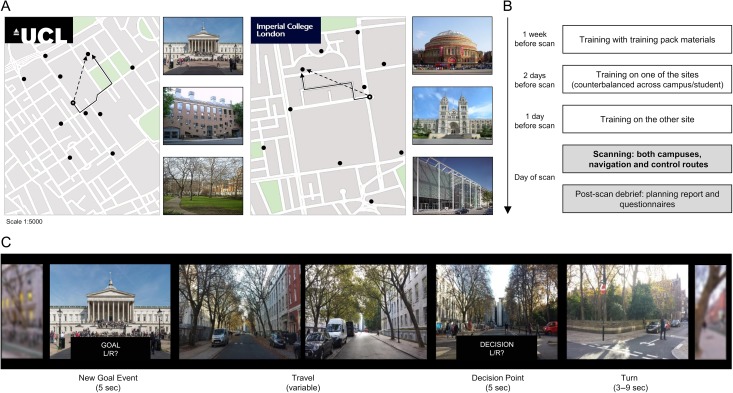
Campus layouts and training protocol. (A) Participants navigated around either UCL (left) or Imperial College campus (right), finding their way to various goal locations (examples depicted to the right of the maps—note not all goal locations were necessarily famous). The maps show all potential goal locations marked with black circles. The open circle represents an example participant location, the solid and dashed black lines indicate the optimal path to be taken (Path Distance), and Euclidian distance (“as the crow flies”), respectively, to the current goal location. (B) The training protocol consisted of 2 stages. First, a self-guided learning of landmarks and campus layouts with printed training materials. Two days before the fMRI scan participants were taken on an intensive guided tour of one of the campuses, and the next day, they were taken around the other campus. The order was counterbalanced across subjects and could start at either their home campus or the new one. On the day of scanning, participants completed routes in both campuses, in both active navigation and a control condition that involved following directions. During the debrief session, they filled out questionnaires regarding navigation strategies, and performed a behavioral task where they indicated where along the route they engaged in planning while navigating. (C) Excerpt from a “navigation” route at UCL. At the start of every route, participants were shown via text on the screen the street they are on, as well as their cardinal facing direction. Next they were given a New Goal Location, and subsequently asked to indicate the general direction of that landmark. They traveled down the road until they reach a junction (the duration and number of images of this was variable depending on the length of the street), at which point they were asked to indicate the correct turn to take towards the goal (Decision Point). Here, the program automatically advanced on a predefined route, which may have been correct, or it may have been an unplanned detour (occurring less frequently). After a variable interval, a new street was entered and the participant was informed again of their location and facing direction. Note the jittered interval after Decision Points is to allow for separating signals relating to Decision Points and Turns (or Detours). Analysis of fMRI data was constrained to the Travel and Decision Point periods. For fMRI analysis, Travel periods were taken as the midpoint between 2 events, and modeled as a punctate event. For simplicity, the above figure only depicts part of a route, and Travel is shown as 2 frames, but could range between 3 and 48 frames (on average: mean 31 ± 18).

