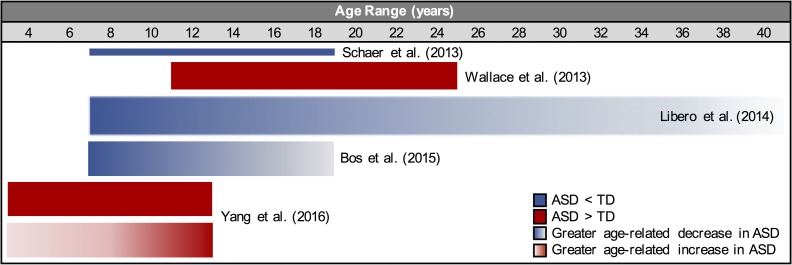
Figure 1.
Gyrification effects by age, as reported in previous ASD studies using the local Gyrification Index (lGI). Solid blue indicates lower reported lGI in ASD (frontal, parietal, and occipital regions). Solid red indicates reported greater gyrification in ASD (frontal, parietal, and temporal regions). Red gradient indicates reported greater age related increase in gyrification in ASD (frontal and parietal regions). Blue gradient indicates reported greater age related decline in gyrification (frontal and parietal regions). Bar width corresponds to relative sample size.

