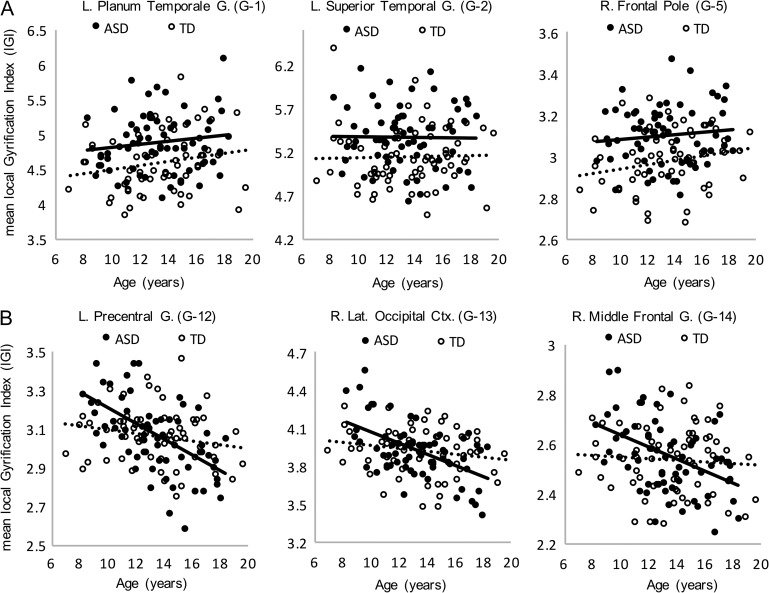
Figure 3.
(A) Main effects of group on lGI. Plots illustrate greater average gyrification index in the ASD group in 3 representative clusters (linear fits show age effects on lGI by group; Cluster G-1: ASD R2 = 0.018, TD R2 = 0.041; G-2: ASD R2 = 0.001, TD R2 = 0.001; G-5: ASD R2 = 0.011, TD R2 = 0.038). (B) Group by age interaction effects on local Gyrification Index (lGI). The negative effect of age is greater in the ASD group in each of 3 clusters exhibiting group by age interaction effects (SDSU Sample; Cluster G-12: ASD R2 = 0.278, TD R2 = 0.033; G-13: ASD R2 = 0.288, TD R2 = 0.032; G-14: ASD R2 = 0.201, TD R2 = 0.005). Cluster labels correspond to those in Figure 2.

