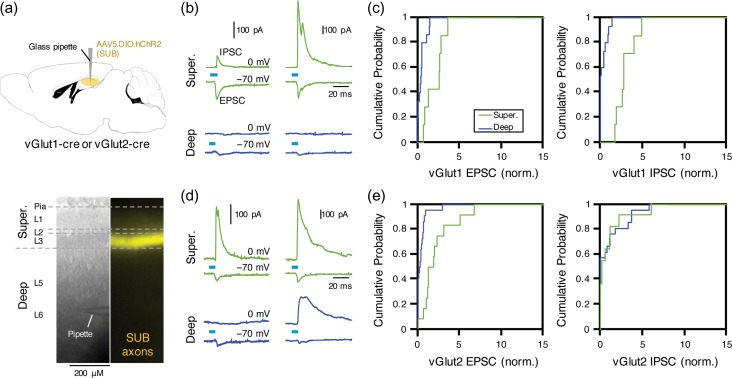
Figure 4.
vGlut2+ RSC-projecting neurons in the dorsal SUB generate more feedforward inhibition than vGlut1+ neurons. (a) Schematic of injection performed. AAV-DIO-hChR2 was injected into subiculum of either vGlut1- or vGlut2-cre mice (top). Example bright-field and epifluorescence images of RSC slice prepared from vGlut1-cre mouse. Laminar borders are indicated with dotted line (bottom). Layers are further divided into superficial and deep layers. SUB, subiculum. (b) EPSC and IPSC recorded from pyramidal neurons in superficial (green) and deep layers of RSC in slice from vGlut1-Cre mice. Traces from 2 neurons are shown (left and right). (c) Cumulative distribution histogram of normalized EPSC (left) and IPSC (right) evoked by stimulating vGlut1-positive subicular axons. Each input was normalized to average input recorded from all neurons in same slice. EPSC to superficial (2.1 ± 0.36) versus deep (0.47 ± 0.16): P < 0.01, Kolmogorov–Smirnov (KS), n = 7 and 15, 4 slices. IPSC to superficial (2.9 ± 0.37) versus deep (0.32 ± 0.15): P = 0.001, k–s, n = 7 and 15, 4 slices. (d) Same as (b), but from vGlut2-Cre mice. (e) Same as (c), but for EPSC and IPSC evoked by stimulating vGlut2-positive subicular axons. EPSC to superficial (2.2 ± 0.65) versus deep (0.39 ± 0.21): P = 0.001, KS test, n = 12 superficial and 22 deep neurons, 6 slices. IPSC to superficial (0.9 ± 0.58) versus deep (1.05 ± 0.56): P = 0.46, KS test, n = 12 and 21 neurons, 6 slices.

