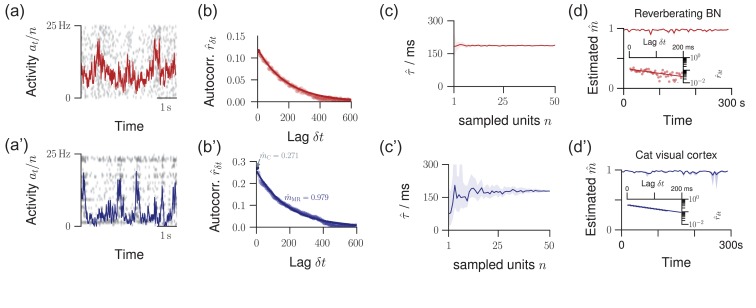
Figure 2.
Validation of the model assumptions. The top row displays properties from a reverberating model, the bottom row spike recordings from cat visual cortex. (a/a’) Raster plot and population activity within bins of , sampled from neurons. (b/b’) Multistep regression (MR) estimation from the subsampled activity (5 min recording). The predicted exponential relation provides a validation of the applicability of the model. The experimental data are fitted by this exponential with remarkable precision. (c/c’) When subsampling even further, MR estimation always returns the correct timescale (or ) in the model. In the experiment, this invariance to subsampling also holds, down to neurons (shaded area: 16–84% confidence intervals estimated from 50 subsets of neurons). (d/d’) The estimated branching parameter for 59 windows of length suggests stationarity of over the entire recording (shaded area: 16–84% confidence intervals). The variability in over consecutive windows was comparable for experimental recording and the matched model (, Levene test). Insets: exponential decay exemplified for one example window each.

