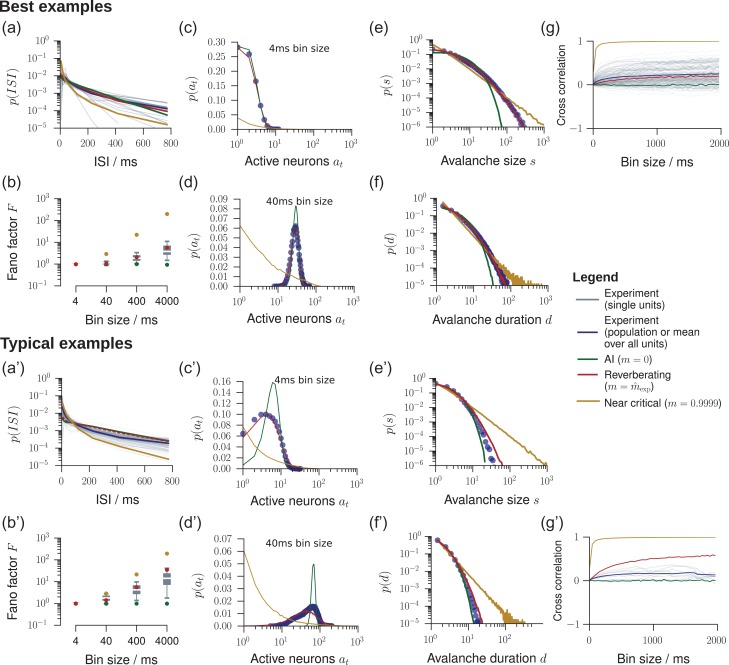
Figure 4.
Model validation for in vivo spiking activity. We validated our model by comparing experimental results to predictions obtained from the in vivo-like, reverberating model, which was matched to the recording in the mean rate, inferred , and number of recorded neurons. In general, the experimental results (gray or blue) were best matched by this reverberating model (red), compared to asynchronous-irregular (AI, green) and near-critical (yellow) models. From all experimental sessions, best examples (top) and typical examples (bottom) are displayed. For results from all experimental sessions see Figs S2–S8. (a/a’) Inter-spike-interval (ISI) distributions. (b/b’) Fano factors of single neurons for bin sizes between 4 ms and 4 s. (c/c’) Distribution of spikes per bin at a bin size of 4 ms. (d/d’) Same as c/c’ with a bin size of 40 ms. (e/e’) Avalanche size distributions for all sampled units. AI activity lacks large avalanches, near-critical activity produces power-law distributed avalanches, even under subsampling. (f/f’) Same as e/e’, but for the avalanche duration distributions . (g/g’) Spike count cross-correlations () as a function of the bin size.

