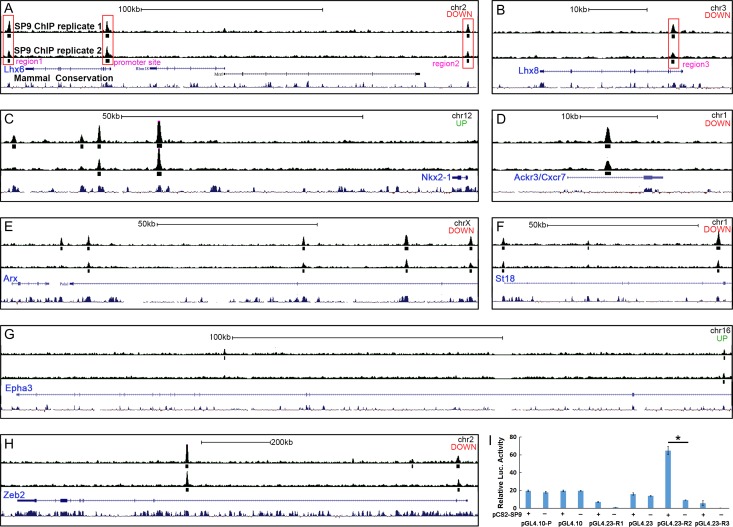
Figure 10.
Anti-SP9 ChIP-Seq Results. (A–H) “Called” peak (small rectangles) locations relative to genomic loci are shown for genes that are deregulated in Sp9-CKOs and for which ChIP-seq peaks were identified within 1 Mb of the gene body. Note the different scale bars for individual panels. For each panel, “up” or “down” indicates whether the gene was upregulated or downregulated in the Sp9 mutant MGE. chr, chromosome; kb, kilobase. Large red rectangles highlight where SP9 binds to the promoter and several downstream or upstream regions (regions 1-3) of Lhx6 and Lhx8 genes (A, B). (I) SP9 activated transcription from a putative Lhx6 enhancer (R2, region 2) in a dual-luciferase assay within P19 cells. (Student’s t-test, *P < 0.05, n = 3 individuals, mean ± SEM).

