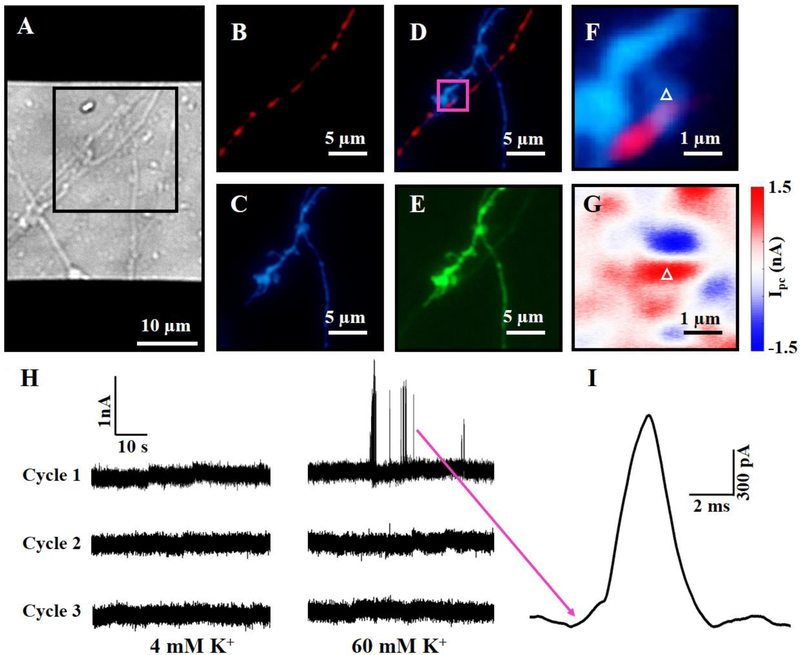
Fig. 3.
(A) DIC image of neurons, at day 9 in culture, atop a graphene transistor. Zoom-in fluorescence images of the black square region in Fig. 3A: (B) mCherry-synaptophysin (red); (C) mCerulean (blue); (D) overlay of mCerulean and mCherry-synaptophysin; and (E) GFP-GCaMP6s (green). Detailed fluorescence (F) and photocurrent (G) images of the magenta square region in Fig. 3D. (H) Photocurrent responses of a graphene-synapse junction (white triangles in Fig. 3F and 3G) upon three high-K+ stimulation cycles (4–60–4–60–4–60). (I) Spontaneous waveform of a spike burst indicated by a magenta arrow in Fig. 3H.

