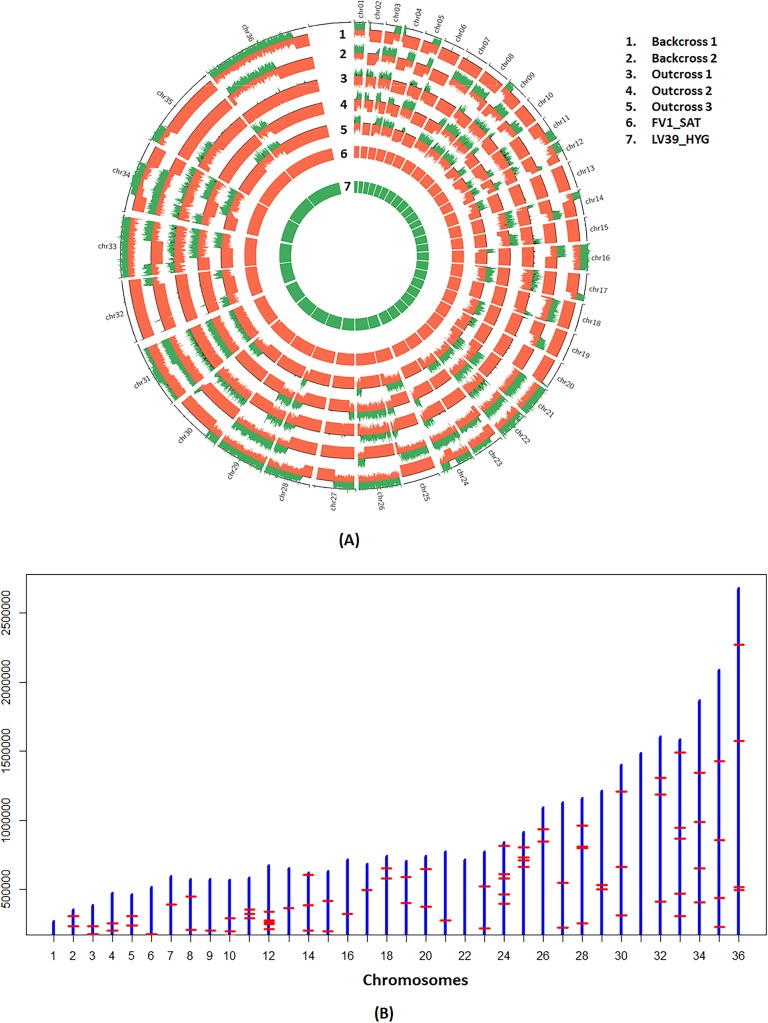
Fig 3. Genome-wide zygosity profiles and recombination breakpoints of the L. major backcross and outcross hybrids.
A) The parental allele frequencies determined using AGELESS are depicted in bottle brush layout using circos plots. The height of the bars indicates contributions from parental lines shown in red for LmFV1/SAT on positive y axis and in green for LV39/HYG on negative y-axis. Boundaries between heterozygous regions where contributions from both parents are observed and the homozygous regions where contribution from only LmFV1/SAT is observed, identify the recombination breakpoints. B) The recombinations observed in the 5 hybrid clones generated between the F1 hybrid, 1.16.A1, and either LmFV1/BSD or LmSd/BSD are plotted by chromosome, which are represented by the blue vertical bars that are roughly scaled to the chromosome lengths. The red horizontal bars indicate the collective recombination breakpoints observed in the 5 hybrids.

