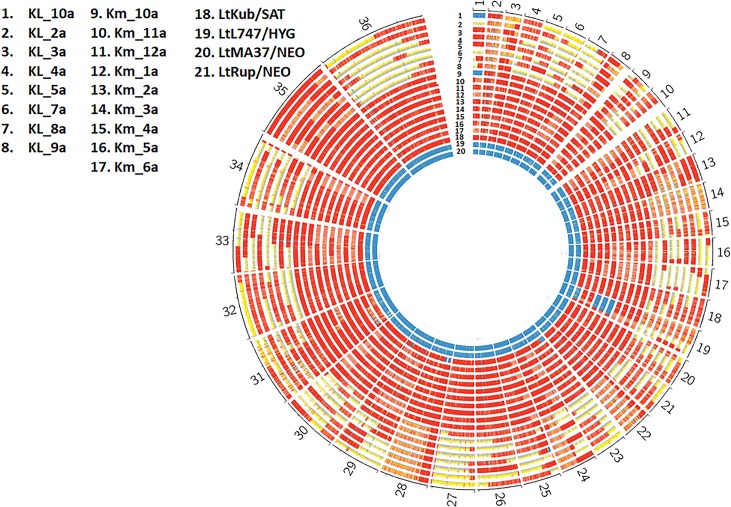
Fig 4. Genome-wide zygosity profiles in hybrids generated between LtKub/SAT and Lt L747/HYG (KL) or LtMA37/NEO (KM).
The number of SNPs per 5kb window are depicted in red if the percentage of heterozygous SNPs was greater than 90%, in blue if the percentage of homozygous SNPs was greater than 90%, and in yellow otherwise. The patterns indicate a range of heterozygosities in the hybrids distributed in discreet blocks similar to what is commonly observed in backcrosses as a result of genetic recombination.

