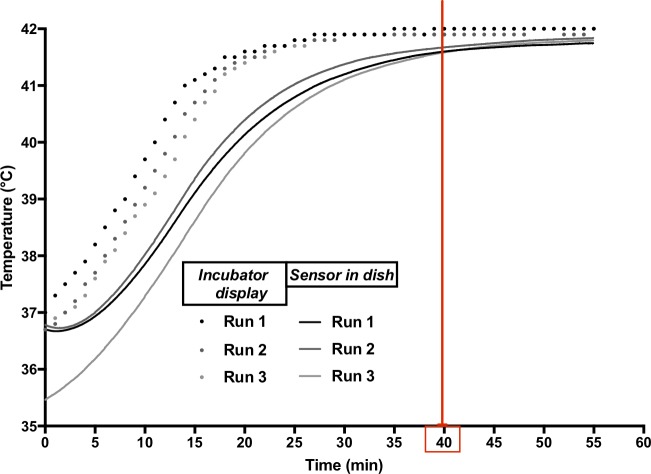
Fig 1. Temperature profile of the incubator during heat-up phase to 42°C steady-state hyperthermia.
Dots represent temperature read off the incubator display over three independent runs, and lines represent the temperature recorded by a sensor placed in the culture dish, immersed in medium during those same runs.

