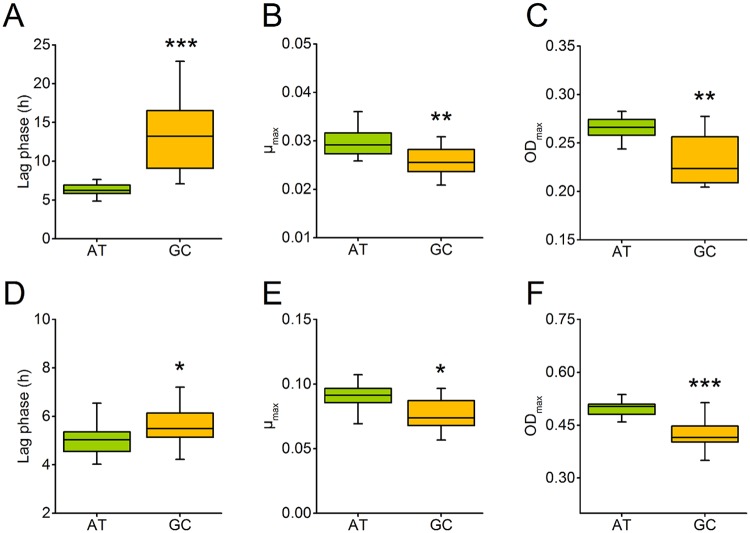
Fig 2. Cells containing GC-rich plasmids are less fit than those with AT-rich plasmids.
Growth experiments of E. coli harbouring AT-rich (green) or GC-rich (orange) pJet (A,B,C) or pBAV plasmids (D,E,F) were performed in minimal medium. Growth over 24 h measured as optical density at 600 nm was used to calculate fitness-relevant parameters. (A,D) Duration of lag phase, (B,E) maximum growth rate, and (C,F) maximum optical density reached (C,F) after 24 h of cells, harbouring either AT-rich or GC-rich plasmids. Asterisks indicate significant differences between cells containing AT-rich and GC-rich plasmids. Independent-samples t-test: *** P < 0.001, ** P < 0.01, and * P < 0.05, n = 16.

