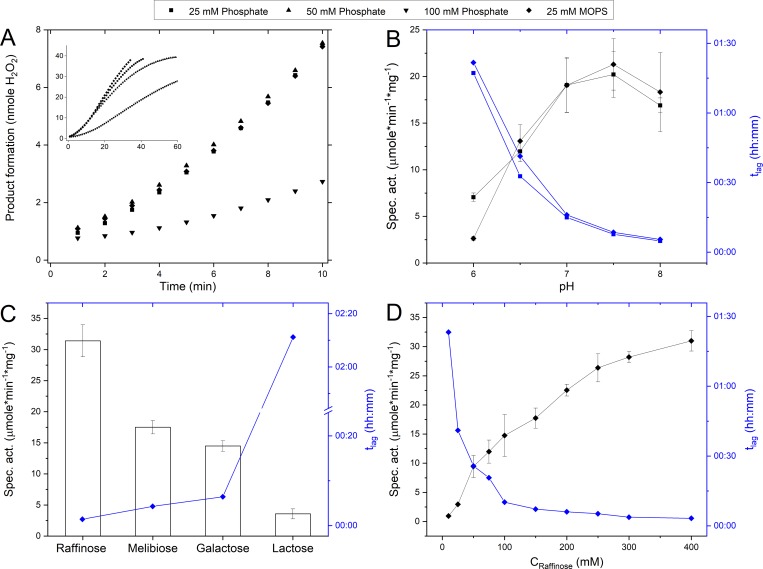
Fig 4. Lag-phase of PruAA5_2A activity.
The lag-phase (tlag) is defined as the time from initiation of the reaction (T = 00:00) to where the maximum slope crosses the x-axis. (A) Impact of buffer type and concentration on rate of product formation during oxidation of 300 mM raffinose (pH 7.5). (B) Impact of pH on reaction rate and tlag, during oxidation of 300 mM raffinose. pH was established using 25 mM sodium phosphate buffer and 25 mM MOPS. (C) Impact of substrate on reaction rate and tlag, where each substrate was prepared to 300 mM in 25 mM MOPS (pH 7.5). (D) Impact of substrate concentration on reaction rate and tlag, where raffinose was prepared in 25 mM MOPS (pH 7.5). n = 4 error bars indicate standard deviation.

