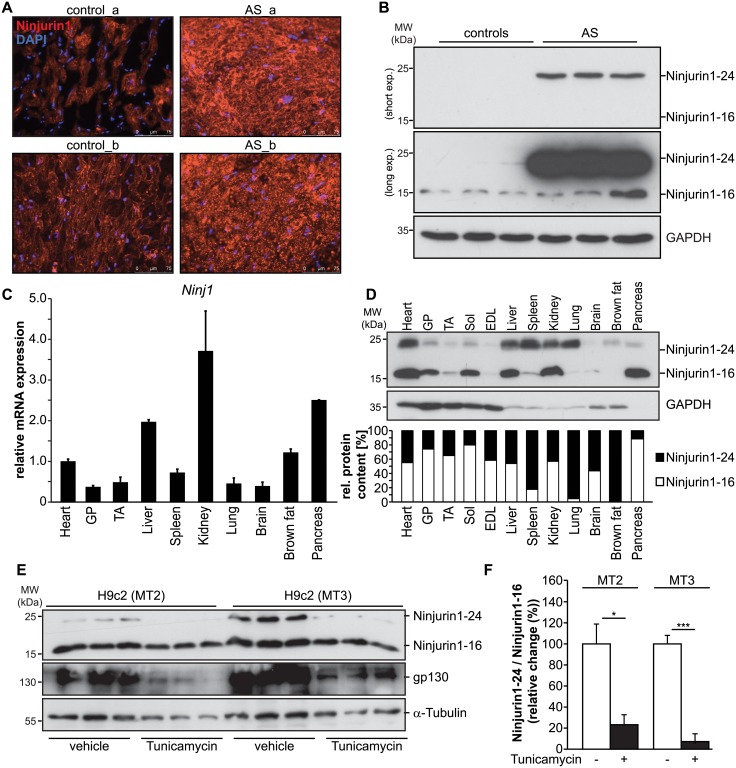
Fig 1. Ninjurin1 is increased in hypertrophic left ventricle of patients with severe aortic stenosis.
(A) Immunofluorescent staining of cryosections from biopsy specimen of two AS (AS_a, AS_b) and two donor (control_a, control_b) hearts with anti-Ninjurin1 as primary antibody and Alexa Fluor 555 conjugated secondary antibody. Nuclei were stained with DAPI (blue). MW, molecular weight; kDa, kilo Dalton. Scale bar, 75 μm. (B) Western blots of proteins isolated from left ventricular tissue of patients with severe aortic stenosis (AS) undergoing elective aortic valve replacement surgery (n = 3) and donor hearts (n = 3) using anti-Ninjurin1 antibody. GAPDH was used as loading control. The Ninjurin1 isoforms at 16kDa (Ninjurin1-16) and 24kDa (Ninjurin1-24) are differentially expressed therefore the membranes underwent short and long exposure, indicated by short exp. and long exp., respectively. (C) Quantitative RT-PCR analysis of Ninjurin1 (Ninj1) in different mouse tissues obtained from untreated C57BL/6J mice as indicated (n = 3). 18S ribosomal RNA expression was used as reference. Data are presented as mean ± SD. (D) Representative immunoblot of proteins isolated from different mouse tissues using anti-Ninjurin1 antibody. GAPDH was used as loading control. The Ninjurin1 isoforms at 16kDa (Ninjurin1-16) and 24kDa (Ninjurin1-24) are indicated. Graph: Densitometric analysis of (B). The total Ninjurin1 content (Ninjurin1-16 plus Ninjurin1-24) per tissue was set as 100% and the relative amount of Ninjurin1-16 and Ninjurin1-24, respectively, was related to that. GP indicates gastrocnemius / plantaris; TA, tibialis anterior; Sol, soleus; EDL, extensor digitorum longus. (E) Western blots of proteins isolated from 2 days (MT2) or 3 days (MT3) differentiated H9c2 cells, treated with 1μg/ml Tunicamycin or vehicle (1 mg/ml dimethylsulfoxide) for 48 h, as indicated. Detection of Ninjurin1 and glycoprotein 130 (gp130) using specific antibodies. Tubulin was used as loading control. (F) Densitometric analysis of (E); data are presented as mean ± SD. * P = 0.05; *** P < 0.001. A two-tailed, unpaired Student’s t-test was used to calculate the P values.

