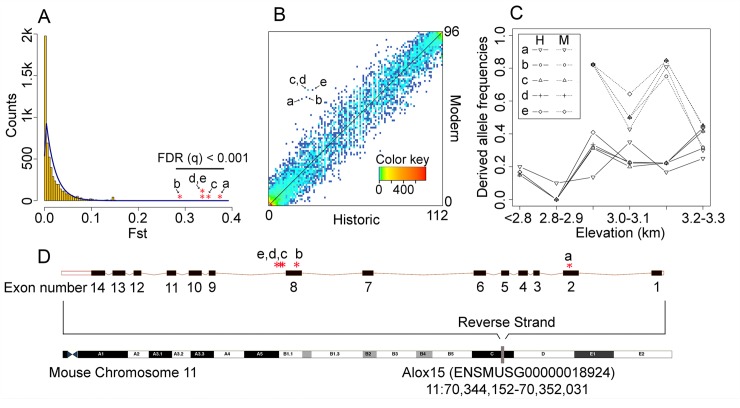
Fig 4. Derived alleles showing significant frequency shifts between historic and modern populations of Tamias alpinus in YNP.
(A) Five outlier SNPs (a-e, FDR q < 0.001) are labeled on a plot of the neutral per site temporal FST distribution (modern versus historic) estimated by OutFLANK. The histogram of observed FST (yellow bins) is shown with the inferred neutral distribution (blue line). (B) Unfolded two-dimensional site frequency spectrum (2D-SFS) for SNPs between historic (x-axis) and modern (y-axis) YNP Tamias alpinus specimens. The color of each data point represents the number of SNPs (depicted by the color key) belonging to that particular 2D-SFS category. Arrows point to the five outliers (a-e) showing the only significant allele frequency shifts over time. (C) Derived allele frequencies of the five outliers SNPs plotted against sample elevation. Individual sample localities were pooled into 100-meter elevational bands to enable allele frequency estimation. (D) The position of the five outliers mapped onto the Alox15 gene in the Mus musculus reference genome. SNP ‘a’ is a synonymous mutation (A/G) in exon 2 (Chromosome 11:70350801); SNP ‘b’ is synonymous (T/C) and maps to exon 8 (11:70347260); SNPs ‘c’ (T/A), ‘d’ (T/G), and ‘e’ (T/G) are located in the intron between exon 8 and 9.

