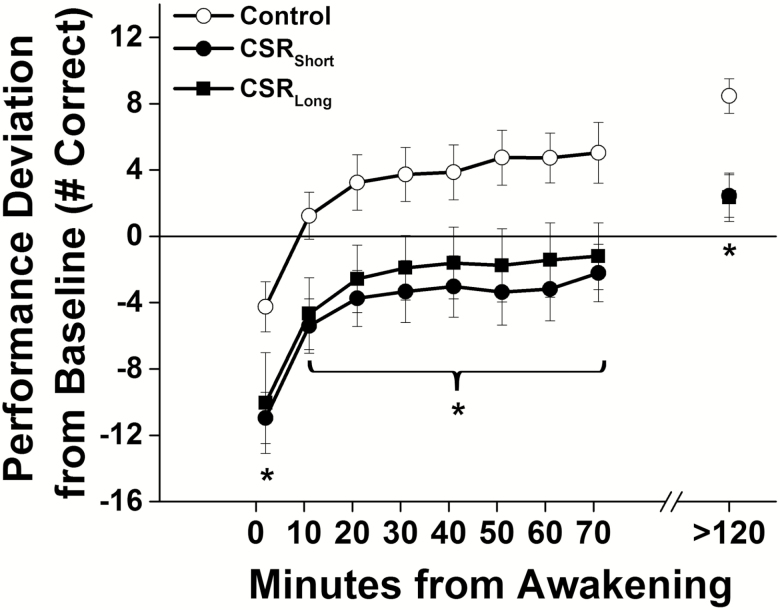
Figure 1.
Performance after awakening under different sleep conditions throughout the forced desynchrony protocol. Number of correct responses on the Digit Symbol Substitution Task (DSST) under Control conditions (equivalent of 8 hr scheduled sleep per 24 hr, open symbols) and under both chronic sleep restriction (CSR) conditions (equivalent of 5.6 hr scheduled sleep per 24 hr, closed symbols) are plotted as average (± St. Err; error bars) deviation from Baseline for each individual (solid horizontal line) on y-axis and by minutes since awakening from sleep on x-axis. Data plotted below average Baseline performance levels indicate performance impairment. Asterisks indicate a significant difference using mixed model techniques and t-tests (p < 0.05) between the combined CSR conditions and Controls. Data are from n = 26 participants.

