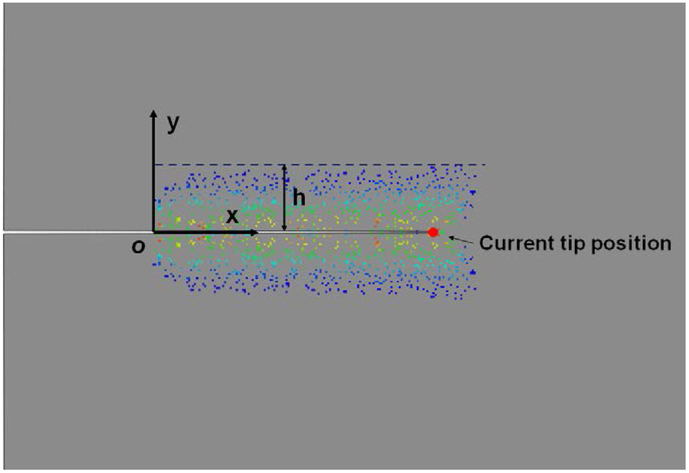
Fig. 4.
Distribution of inclusions that underwent plastic deformation, with colors representing the maximum principal plastic strain over the loading history (ranging from 60 × 10−6, blue, to 5 × 10⁻³, red). The current crack tip position is marked by the red circle, while the initial crack tip position is at O.

