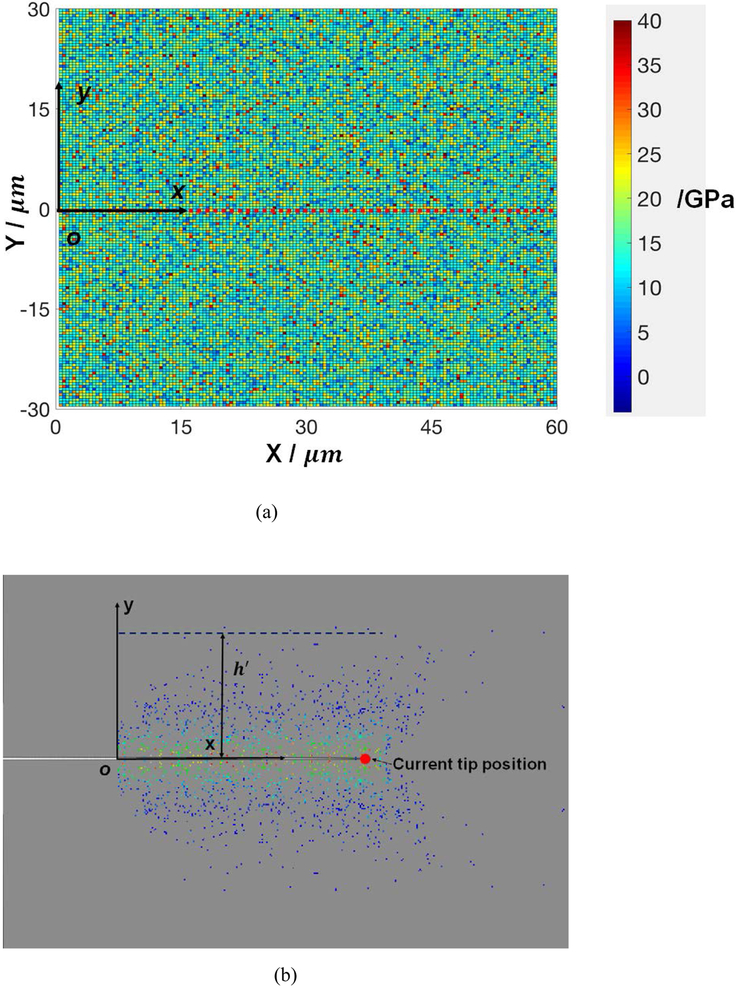
Fig. 6.
(a) Region B of the model with elastic constants in B − ℑ selected from a Gamma distribution with coefficient of variation CVE = 0.4. The colors represent the local value of the stiffness, E. Inclusions forming sub-domain ℑ are not shown. (b) Distribution of inclusions that underwent plastic deformation as the crack tip moved from O to the current location marked by the red circle. The system corresponds to the case in (a). The colors represent the maximum principal plastic strain in inclusions over the loading history (ranging from60 × 10−6, in blue, to 8 × 10⁻³, in red). The heterogenity in B − ℑ is not shown. This figure can be compared with Fig. 4.

