
Extended Data Figure 6. |. Characterization of cytoplasmic DNA in senescent cells.
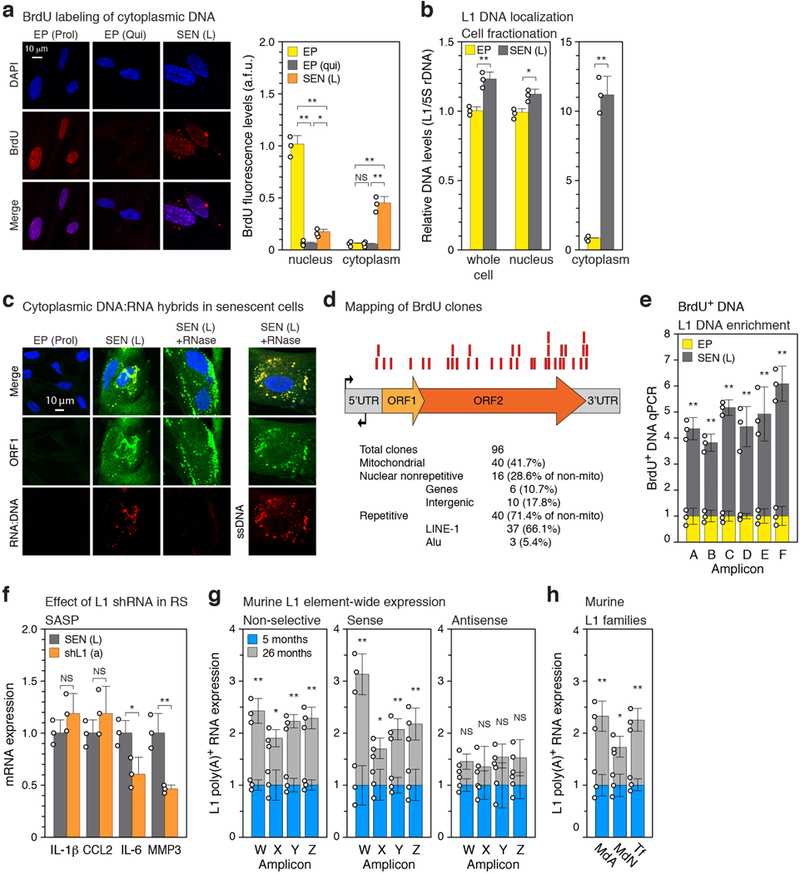
a, Quiescent and senescent cells were treated with BrdU as in Fig. 3a and the cellular localization of BrdU incorporation was visualized by IF microscopy. Proliferating cells, EP(Prol), are shown as a positive control for nuclear BrdU incorporation. The signals were quantified using CellProfiler software (right panel, Methods). >200 cells were examined for each condition (a.f.u., arbitrary fluorescence units). b, Senescent (and EP control) cells (neither labeled with BrdU) were fractionated into nuclear and cytoplasmic fractions, and the representation of L1 sequences in these compartments (as well as whole cells) was assessed with qPCR as in Fig. 3a (TaqMan multiplex qPCR assay16, amplicon F, Fig. 1b). Note that the Y axis units differ by 10-fold between the left and right panels. c, Cells were examined by IF microscopy for the presence of ORF1 protein, RNA-DNA hybrids, and single-stranded DNA (ssDNA). See Methods and Supplementary Table 2 for antibodies. The RNA-DNA signal in senescent cells largely colocalized with the ORF1 signal and was lost after RNase A treatment. The ssDNA signal also colocalized with the ORF1 signal and was exposed by RNase treatment. The experiment was repeated 3 times with similar results. d, The pulled-down BrdU-containing DNA (Fig. 3c, panel (a) above, Methods) was cloned and Sanger sequenced. Of the 96 total clones examined 37 mapped to L1. Red boxes represent the relative positions of these clones on the L1 consensus sequence. e, Senescent cells labeled with BrdU (Fig. 3c, panel (a) above) were immunoprecipitated with anti-BrdU antibodies, and the representation of L1 sequences in the pulled-down DNA was assessed using qPCR with primers spanning the entirety of L1 elements (Fig. 1b, c). f, Senescent cells were treated with L1 shRNA (using lentiviral vectors as described in Extended Data Fig. 5g) between 12 and 16 weeks of senescence, and expression of SASP genes was determined. g, Transcription throughout murine L1 elements was assessed in a strand-specific manner using the same strategy as was applied to human L1 elements (Fig. 1b, c). The amplicons (designated W-Z to distinguish them from the human-specific primers) correspond to the 5’UTR (W), Orf1 (X), Orf2 (Y) and 3’UTR (Z). Also see Methods and Supplementary Table 1 for primer sequences (primer sets 37, 48–50). Poly(A) RNA was prepared from male white adipose tissue. A total of 12 animals were assessed (3 pools of 4 animals each) in 3 independent experiments. h, Expression of the three currently active families of murine L1 elements. Primers were designed to distinguishing 5’UTR polymorphisms of the MdA, MdN and Tf families (Methods, Supplementary Table 1 primer sets 51–53). RT-qPCR was performed as in (f) above (non strand-specific). (a, b, e) n = 3 independent biological samples, repeated in 2 independent experiments. (f), n = 3 independent experiments. (a, e-h) Data are mean ±s.d. *P ≤ 0.05, **P ≤ 0.01. (a) 1-way ANOVA with Tukey’s multiple comparisons test, (b, e-h) unpaired two-sided t-tests, Exact P values can be found in the accompanying Source Data.