
Extended Data Figure 7. |. Effects of ablating L1 activation, the cytoplasmic DNA sensing pathway, or interferon signaling on expression of the IFN-I and SASP responses.
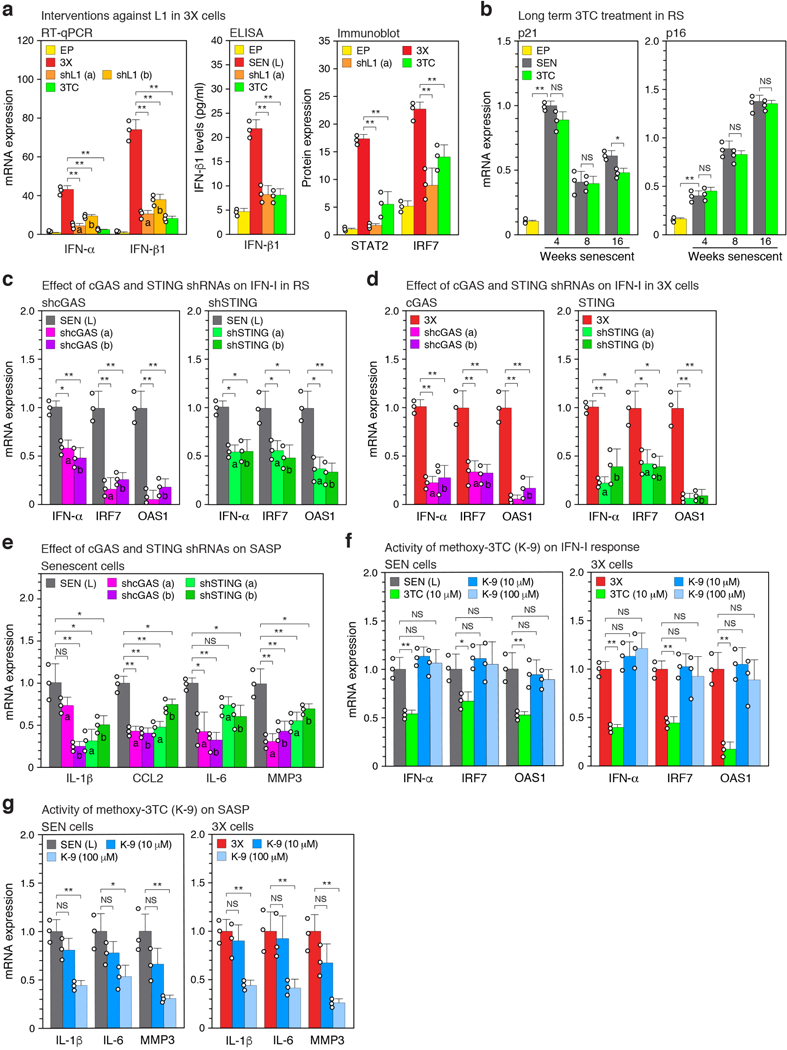
a, 3X cells were treated with L1 shRNA or with 3TC for 48 hours as described in Extended Data Fig. 5g,i. Effects on the IFN-I response were determined by RT-qPCR, ELISA or immunoblotting. For gel source data see Supplementary Fig. 1. b, Cells were serially passaged into replicative senescence (RS) with 3TC (10 μM) present throughout as in Fig. 3f, and expression of Cdk inhibitors p21 and p16 was assessed by RT-qPCR. c, Senescent cells were treated with shRNAs against cGAS or STING between 12 and 16 weeks of senescence (as described in Extended Data Fig. 5l), and expression of IFN-I response genes (IFN-α, IRF7, OAS1) was determined. d, cGAS and STING knockdowns were performed with shRNAs in 3X cells (as in panel (c) above), and expression of IFN-I genes was examined by RT-qPCR. e, cGAS and STING were knocked down in senescent cells with shRNAs (as in panel (c) above) and expression of SASP response genes (IL-1β, CCL2, IL-6, MMP3) was assayed by RT-qPCR. f, g, The activity of K-9 was compared with 3TC in senescent and 3X cells. Senescent cultures were treated between 12 and 16 weeks (as in Fig. 3b) and 3X cultures for 48 hrs. (as in panel (a) above). Effects on the expression of IFN-I genes (IFN-α, IRF7, OAS1) and SASP genes (IL-1β, IL-6, MMP3) was assessed by RT-qPCR. (a-g), n = 3 independent experiments. (a-g) Data are mean ±s.d. *P ≤ 0.05, **P ≤ 0.01, unpaired two-sided t-tests. Exact P values can be found in the accompanying Source Data.