
Extended Data Figure 9. |. Effects of 3TC or K-9 treatment on L1, p16, IFN-I and SASP gene expression in mouse tissues.
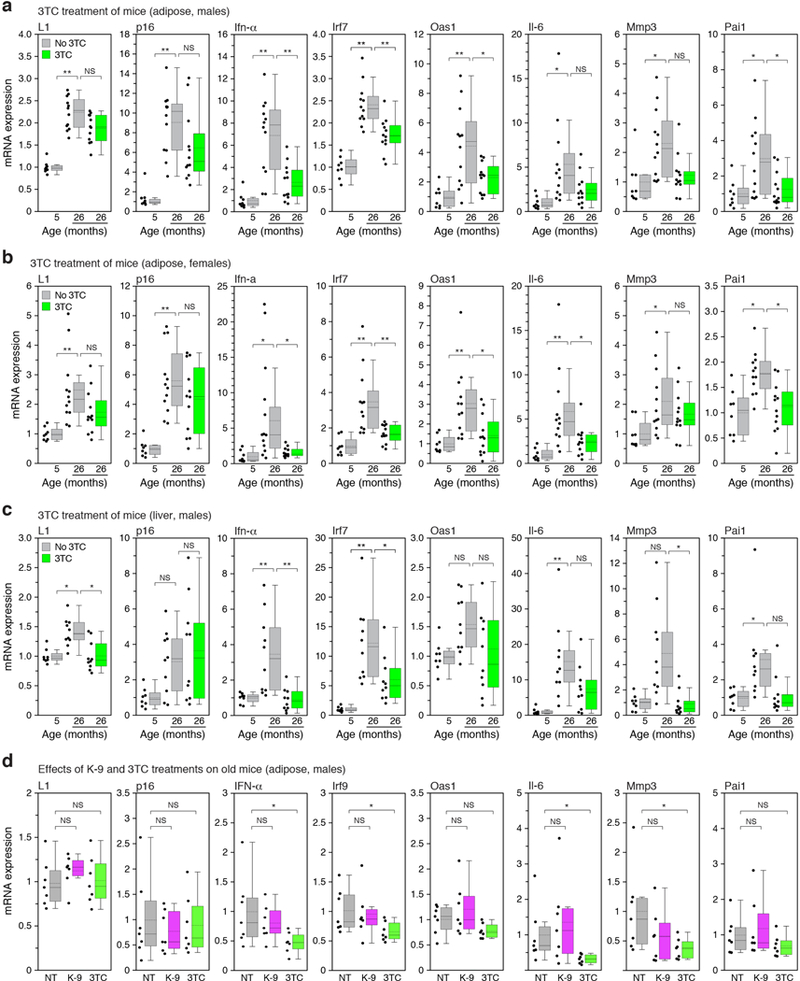
a-c, Mice at the indicated ages were treated with 3TC continuously for two weeks (see also Fig. 4c, e, Extended Data Fig. 10d-f, and Methods). For all conditions the expression of L1 mRNA, p16, three representative IFN-I response genes (Ifn-α, Irf7, Oas1) and three representative SASP genes (Il-6, Mmp3, Pai1) were assessed by RT-qPCR. In no instance was expression at 5 months + 3TC significantly different from the no drug control, therefore these data are not shown in the figure (for all collected data see Supplementary Table 7). The box plots show the range of the data (whiskers), 25th and 75 percentiles (box), means (dashed line), and medians (solid line). Each point represents one animal. a, Visceral white adipose, male mice. 5 months, n=8 animals; 26 months, n=12 animals; 26 months + 3TC, n=12 animals. b, Visceral white adipose, female mice. 5 months, n=8 animals; 26 months, n=12 animals; 26 months + 3TC, n=12 animals. c, Liver, male mice. 5 months, n=8 animals; 26 months, n=10 animals; 26 months + 3TC, n=10 animals. d, Mice at the age of 26 months were treated with K-9 or 3TC in drinking water for two weeks and analyzed by RT-qPCR as above. NT, not treated. Visceral white adipose, male mice, n=7 animals for each group. Data are mean ±s.d. *P ≤ 0.05, **P ≤ 0.01, 1-way ANOVA with Tukey’s multiple comparisons test. Exact P values can be found in the accompanying Source Data.