
Figure 2 |. Regulation of L1 activation and IFN-I induction.
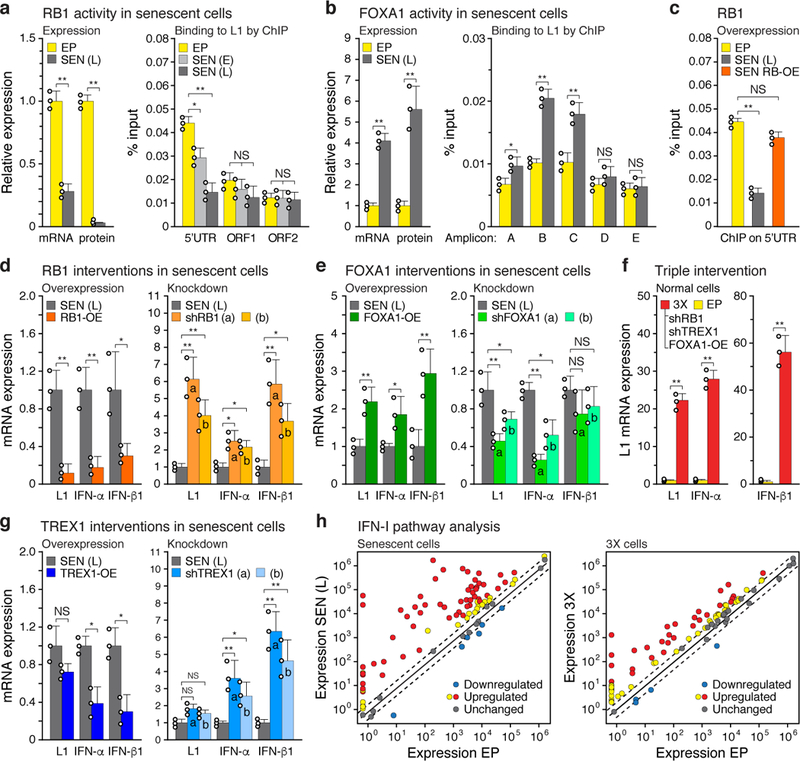
a, Expression and ChIP of RB1 and b, FOXA1. Expression was measured by RT-qPCR and immunoblotting (left panels). Binding to L1 elements was assessed with ChIP-qPCR (right panels). For primer locations see Fig. 1b. RB1: 5’UTR, ORF1 and ORF2, primers for amplicons A, E and F, respectively. FOXA1: primers for amplicons A-E. qPCR was normalized to input chromatin. SEN (E), early senescence (8 weeks). For gel source data see Supplementary Fig. 1. c-e, RB1, FOXA1 or TREX1 were overexpressed (OE) or ablated with shRNAs and the effects on expression of L1, IFN-α and IFN-β1were determined by RT-qPCR of poly(A)-purified RNA. In all cases lentiviral vectors were used to deliver the interventions directly into senescent cells at 12 weeks (point D, Extended Data Fig. 1a), and cells were harvested for analysis 4 weeks later (point E, 16 weeks). Controls were uninfected senescent cells harvested at the same time (point E, 16 weeks). Two distinct shRNAs (a, b) were used for each gene. Primers for amplicon F were used for L1. f, RB1 was overexpressed as above and its binding to the 5’UTR was assessed by ChIP-qPCR (amplicon A). g, Activation of L1, IFN-α and IFN-β1 expression after the triple (3X) intervention using shRB1 (a), shTREX1 (a) and FOXA1-OE in early passage cells. Lentiviral infections were performed sequentially with drug selections at each step (shRB1, puromycin –> shTREX1, hygromycin –> FOXA1-OE, blasticidin). h, Expression of IFN-I pathway genes was determined with the RT2 Profiler PCR array (Qiagen). Normalized mean expression is shown for all 84 genes in the array. Red symbols: significantly upregulated genes. Dashed lines demarcate the ±2-fold range. (a, b, h), n = 3 independent biological samples, repeated in 2 independent experiments. (c-g), n = 3 independent experiments. (a-g) Data are mean ±s.d. *P ≤ 0.05, **P ≤ 0.01, unpaired two-sided t-tests. Exact P values can be found in the accompanying Source Data.