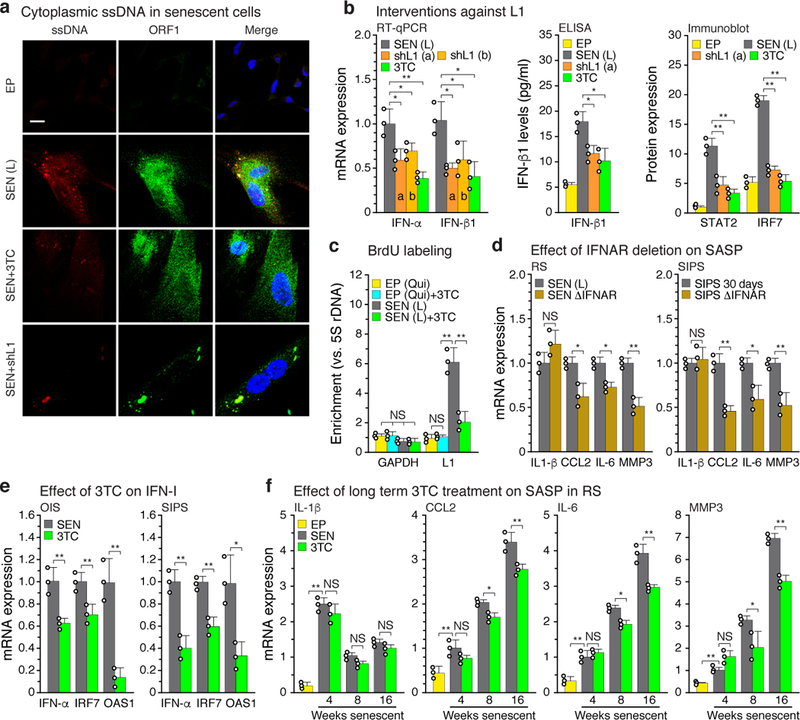
Figure 3 |. Ablation of L1 relieves IFN-I activation and blunts the SASP response.

a, Cells were examined by immunofluorescence (IF) microscopy using antibodies to single-stranded DNA (ssDNA) or L1 ORF1 protein. Note the bright ssDNA puncta in senescent cells that colocalized with prominent puncta of ORF1. The experiment was independently repeated 3 times with similar results. Scale bar = 10 μm. b, Senescent cells were treated with L1 shRNAs (using lentiviral vectors as described in Fig. 2c, e, f) or with 3TC (7.5 μM) between 12 and 16 weeks of senescence. Effects on the IFN-I response were determined by RT-qPCR, ELISA or immunoblotting. For gel source data see Supplementary Fig. 1. c, Cells were labeled with BrdU for 2 weeks (with or without 7.5 μM 3TC), labeled DNA was immunoprecipitated, and its L1 sequence content was quantified using a TaqMan multiplex qPCR assay16 (Fig. 1b, amplicon F). EP (qui), early passage quiescent cells. d, Left panel, RS cells: IFNAR1 and IFNAR2 genes were mutagenized using the CRISPR/Cas9 system delivered with lentivirus vectors directly into senescent cells. As with shRNA interventions, cells were infected at 12 weeks and harvested at 16 weeks of senescence (Fig. 1d-f, Methods). Right panel, SIPS cells: CRISPR/Cas9 intervention was performed in early passage cells and a validated clone was irradiated to induce SIPS. e, OIS and SIPS were induced as in Fig. 1d and cells were harvested 20 days (OIS) or 30 days (SIPS) later. 3TC (7.5 μM) was present throughout. IFN-I gene expression (IFN-α, IRF7, OAS1) was measured by RT-qPCR. f, Cells were serially passaged into replicative senescence (RS) with 3TC (10 μM) present throughout, and the temporal induction of SASP response genes (IL-1β, CCL2, IL-6, MMP3) was assessed. (b-d, f), n = 3 independent experiments. (e) n = 3 independent biological samples, repeated in 2 independent experiments. (b-f) Data are mean ±s.d. *P ≤ 0.05, **P ≤ 0.01. (b, d-f) unpaired two-sided t-tests, (c) 1-way ANOVA with Tukey’s multiple comparisons test. Exact P values can be found in the accompanying Source Data.
