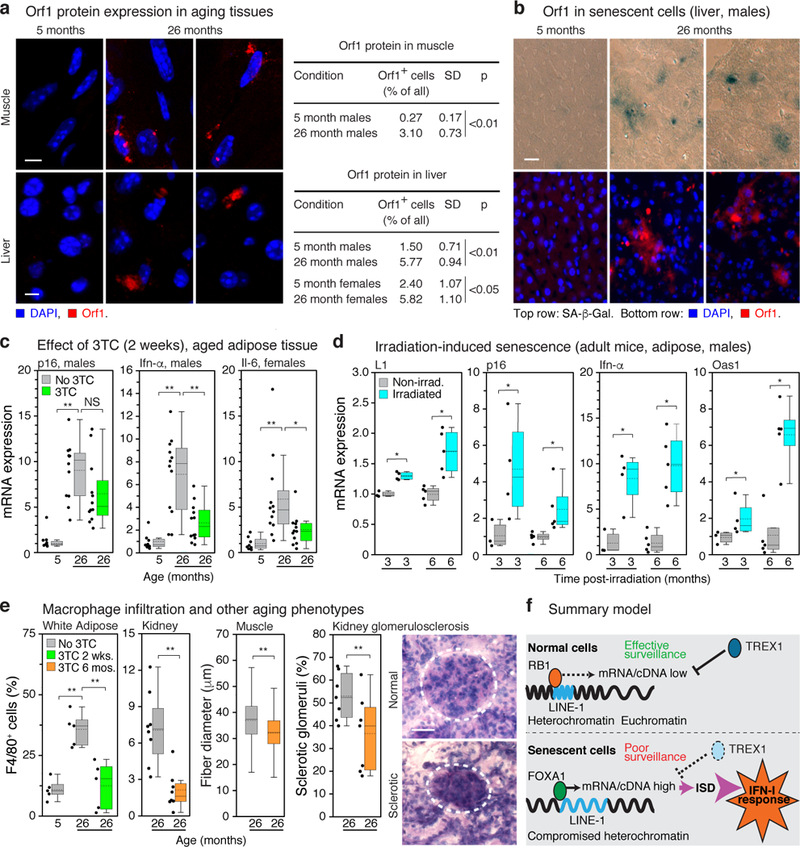
Figure 4 |. L1s are activated with age in murine tissues and the IFN-I proinflammatory response is relieved by NRTI treatment.

a, Presence of L1 Orf1 protein in tissues was examined by IF microscopy. Quantification of ORF1 expressing cells is shown in the right panel; 3 animals and at least 200 cells per animal were scored for each condition. Scale bar = 4 μm. b, Activation of L1 in senescent cells was examined by co-staining for SA-β-Gal activity and Orf1 protein by IF (male liver, 5 and 26 months). Scale bar = 4 μm. The experiment was repeated 3 times independently with similar results. c, Mice were administered 3TC (2 mg/ml) in drinking water at the indicated ages for two weeks and sacrificed after treatment. Expression of p16, an IFN-I response gene (Ifn-α), and a marker of a proinflammatory state (Il-6) were assessed by RT-qPCR. See Extended Data Fig. 9 for additional tissues and genes. The box plots show the range of the data (whiskers), 25th and 75 percentiles (box), means (dashed line), and medians (solid line). Each point represents one animal. 5 months, n = 8; 26 months, n = 12; 29 months, n = 6. d, Six month old mice were non-lethally irradiated and expression of L1, p16 and representative IFN-I response genes (Ifn-α, Oas1) were assessed by RT-qPCR at the indicated times post-irradiation. Graphical presentation is as in (c); non-irradiated, n = 3 animals at 3 months, n = 5 animals at 6 months; irradiated, n = 4 animals at 3 months, n = 5 animals at 6 months. e, Macrophage infiltration into white adipose tissue and kidney was scored as F4/80 positive cells (% of total nuclei). n = 5 animals group (adipose); n = 8 (kidney). Skeletal muscle fiber diameter was measured (Methods) and plotted as an aggregate box plot. n = 5 animals per group, 500 fibers total. Glomerulosclerosis was scored in periodic acid-Shiff (PAS)-stained sections (Methods) as the sum of all glomeruli with a score of 3 or 4 divided by the total. n = 7 animals per group, 40 glomeruli per animal. Graphical presentation is as in (c). 3TC treatment was 2 weeks for white adipose and 6 months (20–26 months) for other tissues. Dashed circle demarcates a single glomerulus. Scale bar = 50 μm. g, Breakdown of L1 surveillance mechanisms leads to chronic activation of the IFN-I response. ISD: interferon-stimulatory DNA pathway. (a, d, e) unpaired two-sided t-tests. (c, e white adipose) 1-way ANOVA with Tukey’s multiple comparisons test. Exact P values can be found in the accompanying Source Data.
