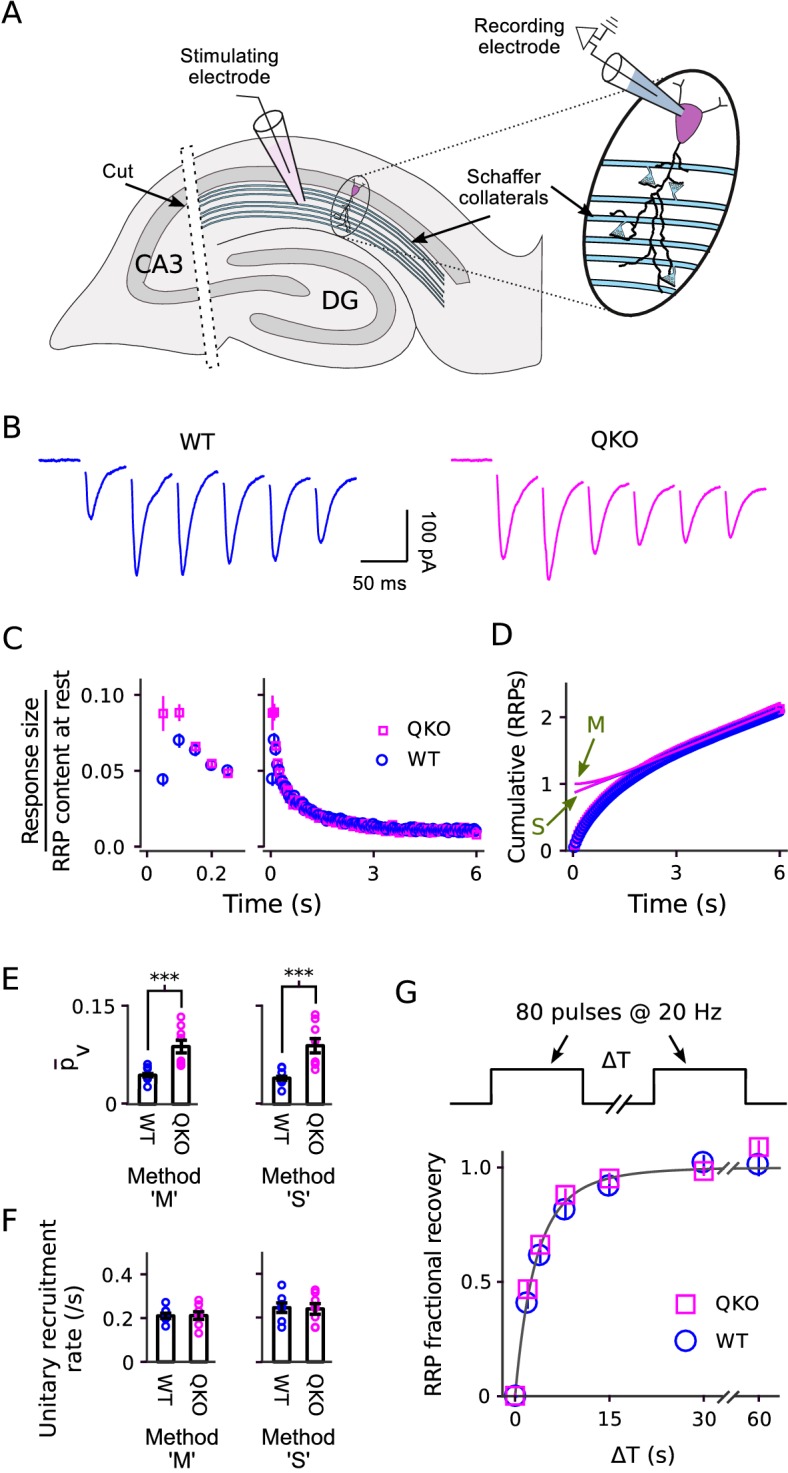
Figure 6. Electrophysiological analysis of Schaffer collateral synapses.

(A) Diagram of ex vivo hippocampal slice preparation. (B-F) Increased at QKO synapses, but no differences in timing of vesicle trafficking during ongoing stimulation. (B) Responses during 20 Hz stimulation; shown are the first 300 ms of -long trains from individual preparations; traces are the average of four trials. (C) Mean sizes of responses vs time. Individual trials were repeated at least three times for each preparation, and each preparation was allowed to rest at least 4 min before beginning each trial (n = 8 preparations per genotype). Responses were measured as the current integral and then normalized by the RRP contents at the start of stimulation calculated as in Wesseling et al. (2002); when normalized this way, the leftmost values are then equal to . (D) Cumulative responses, normalized as in (C). Theoretical curves are labeled as in Figure 3D, except here ‘M’ refers to the theory described in Wesseling et al. (2002), which is analogous to Mahfooz et al. (2016) but specific for hippocampal synapses. (E) values across preparations (p < 0.001; rank sum). Methods ‘M’ and ‘S’ are the same as for Figure 3E. (F) Values for the unitary recruitment rate across preparations. (G) RRP replenishment vs time; the dashed line is with the decaying exponential in Wesseling et al. (2002).
