. 2019 May 8;8:e43890. doi: 10.7554/eLife.43890

Figure 4. Sequential mechanism of branching microtubule nucleation and binding rate of TPX2 to microtubules.

Sequential mechanism of branching MT nucleation (A-C). (A) De novo MTs (blue) were generated by performing branching reaction in augmin-depleted Xenopus egg extracts where TPX2 is present. Non MT-bound, soluble proteins were removed with buffer wash, and Xenopus egg extracts containing augmin but no TPX2 was introduced. Branched MTs (red), with their plus-ends labelled with EB1-mCherry (pseudo-colored as green), nucleated immediately from de novo MTs (blue), highlighted in the zoomed-in region. Late time point (7 min) shows formation of dense branched networks around the initial de novo MTs (blue). 0 s marks the time of extract exchange in the reaction chamber. Scale bar, 10 μm. The experiment was repeated six times with independent egg extract preparations. (B) De novo MTs (blue) were generated by performing branching reaction in Xenopus egg extracts containing augmin but no TPX2. Non MT-bound, soluble proteins were removed with buffer wash, and Xenopus egg extracts containing TPX2 but no augmin was introduced. No branching was seen, and only MT plus-ends elongated (Cy5-MTs in red and EB1-mCherry pseudo-colored as green) was observed. Late time point (7 min) depicted for comparison with (A). 0 s marks the time extract exchange in the reaction chamber. Scale bar, 10 μm. The experiment was repeated four times with independent egg extract preparations. (C) De novo MTs (blue) were generated by performing branching reaction in Xenopus egg extracts containing TPX2 and γ-TuRC but no augmin. Non MT-bound, soluble proteins were removed with buffer wash, and γ-TuRC-depleted Xenopus egg extracts containing TPX2 and augmin was introduced. At initial time points, only elongation of MT plus-ends (red with EB1-mCherry pseudo-colored as green) was observed. Rare branching events were seen at late time point (7 min), highlighted with a white arrow. 0 s marks the time extract exchange in the reaction chamber. Scale bar, 10 μm. The experiment was repeated thrice with independent extract preparations. See also Figure 4—figure supplement 1. (D-E) Endogenous TPX2 was replaced with 20–30 nM recombinant GFP-TPX2 in Xenopus egg extracts. Branched MT networks were generated with 10 μM RanQ69L, and time-lapse of TPX2 on the networks was recorded. MTs were labeled with Cy5-tubulin (red), their plus-ends with EB1 (green), and TPX2 is displayed in cyan. 0 s marks the start of the reaction. Scale bar, 10 μm. Arrows denote the plus-ends, while asterisks show TPX2’s deposition on older lattice regions near the minus-ends and no binding to newly formed plus-ends. The experiment was repeated thrice with independent egg extract preparations. TPX2’s intensity was measured over time on individual pixels (highlighted with a yellow line) corresponding to de novo MT before the first branching event occurred, normalized by single TPX2’s fluorescence and converted into number TPX2 molecules. A representative trace is shown in (E), which was fit to a straight line (red). The slope was calculated to obtain the binding rate of TPX2 as 0.4 ± 0.2 (mean ± s.d.) molecules μm−1 s−1 (n = 32 traces). A constant background noise level of 7 molecules was observed, which does not affect the calculated binding rate. The experiment was repeated thrice with independent extract preparations. See also Figure 4—figure supplement 2.

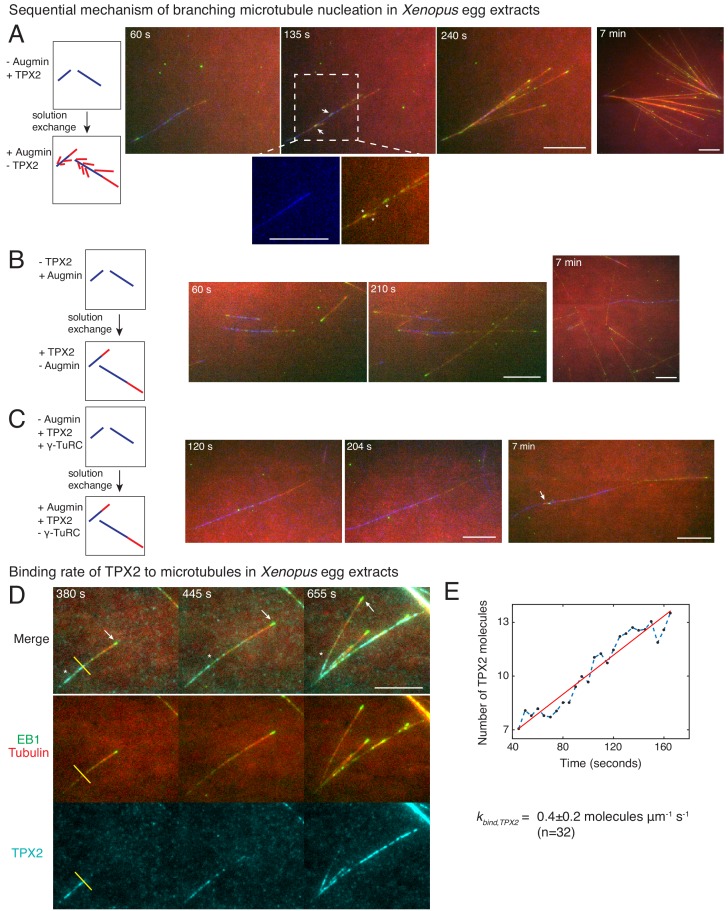
Figure 4.

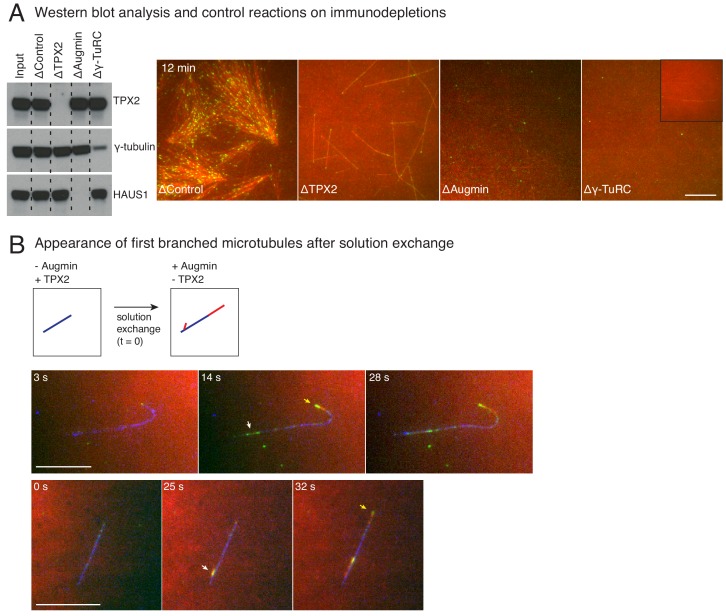
Figure 4—figure supplement 1. Control immunodepletion reactions and measurement of length of initial branched microtubules.

Figure 4—figure supplement 1.

(A) Augmin, TPX2 or γ-TuRC were immunodepleted from Xenopus egg extracts, and western blot analysis against TPX2, γ-tubulin or HAUS1 (augmin subunit) was performed to verify depletion. Branching MT nucleation assay was performed by addition of 10 μM RanQ69L. Representative images at 12 min of the reaction show loss of branching MT nucleation upon augmin or TPX2 immunodepletion, and severe reduction in overall level of nucleation upon γ-TuRC immunodepletion. Low level of γ-TuRCs remain in egg extracts upon immunodepletion with anti-XenC antibody, resulting in rare MTs shown in inset. Scale bar, 10 μm. This analysis was repeated twice with independent egg extract preparations, and the same extracts were used for experiments shown in Figure 4A–C. (B) De novo MTs (blue) were generated by performing branching reaction in Xenopus egg extracts where no augmin is present. Non MT-bound, soluble proteins were removed with buffer wash. The reaction was observed while exchanging the solution to egg extracts containing augmin but no TPX2 at time t = 0 s. Branched MTs (red, denoted with white arrows) and their plus-ends labelled with EB1-mCherry (pseudo-colored as green), nucleated within 10–30 s from de novo MTs (blue) MT, and roughly at the same time as the elongating plus-end (yellow arrows). Scale bar, 10 μm. The experiment was repeated twice with independent egg extract preparations.
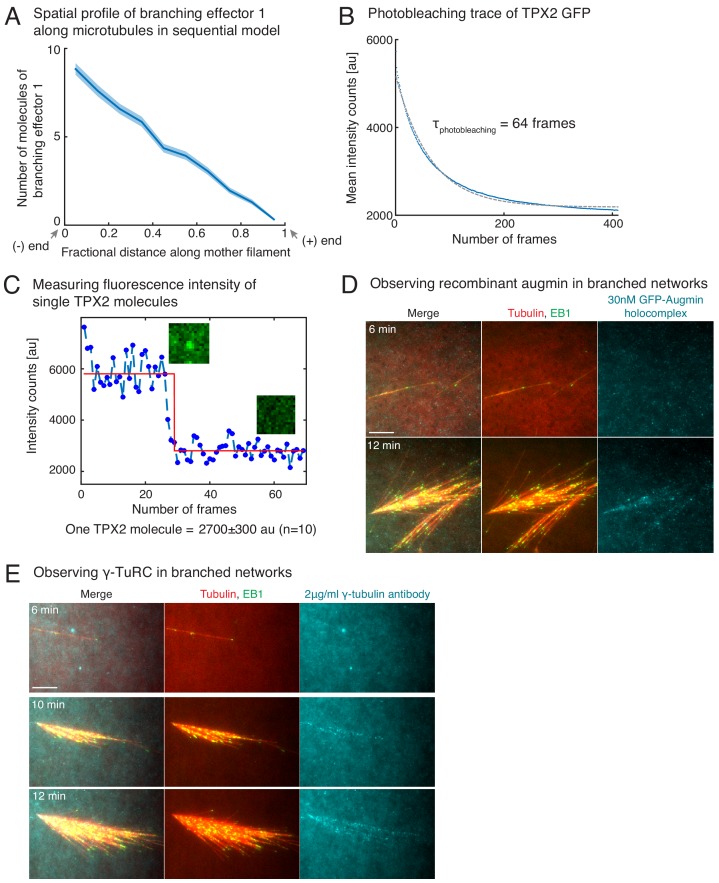
Figure 4—figure supplement 2. Controls for TPX2’s binding rate measurement, and visualization of augmin/γ-TuRC on branched networks.

Figure 4—figure supplement 2.

(A) Distribution of branching effector1 in sequential model was measured along the length of mother MT at 100 s. The number of molecules is plotted after rescaling the length of mother MT to 1 (n = 250 measurements). Shaded regions depict the 95% bootstrap confidence interval. (B–C) Fluorescence photobleaching of GFP-TPX2 was performed by attaching TPX2 to untreated glass coverslips. Mean fluorescence in the field of view was plotted over time in (B) and exponential decay curve was fit to obtain the photobleaching time as 64 frames. Because this time scale is significantly longer than the number of frames used to obtain TPX2’s binding rate from intensity versus time traces in Figure 4E, the effect of fluorescence photobleaching was ignored. Photobleaching step of individual TPX2 molecules was observed to obtain the fluorescence count of a single TPX2 molecule at its center pixel. A representative trace is shown in (C, blue circles), and data was fit to Heaviside function (red curve) using MATLAB curve-fit. Fluorescence of single TPX2 molecule was measured as 2700 ± 300 au (n = 10 traces). (D–E) Observation of augmin and γ-TuRC during branched network formation. Recombinant GFP-augmin holocomplex was added at 30 nM to Xenopus egg extracts. Branched MT networks were generated with 10 μM RanQ69L, and time-lapse of augmin on the networks was recorded in (D). MTs are labeled with Cy5-tubulin (red), their plus-ends with EB1 (green), and augmin is displayed in cyan. 0 s marks the start of the reaction. Alexa-647 labelled XenC antibody against γ-TuRC was added to Xenopus egg extracts at 2 μg/ml in (E). Branched MT networks were generated with 10 μM RanQ69L, and time-lapse of γ-TuRC on the networks was recorded. MTs are labeled with Alexa-488 tubulin (pseudo-colored as red), their plus-ends with EB1 (green), and augmin is γ-TuRC in cyan. 0 s marks the start of the reaction. Both augmin and γ-TuRC are not visible on individual MTs, but appear later as more MTs nucleate in the branched networks. Scale bars, 10 μm. The experiments were repeated thrice with independent egg extract preparations.