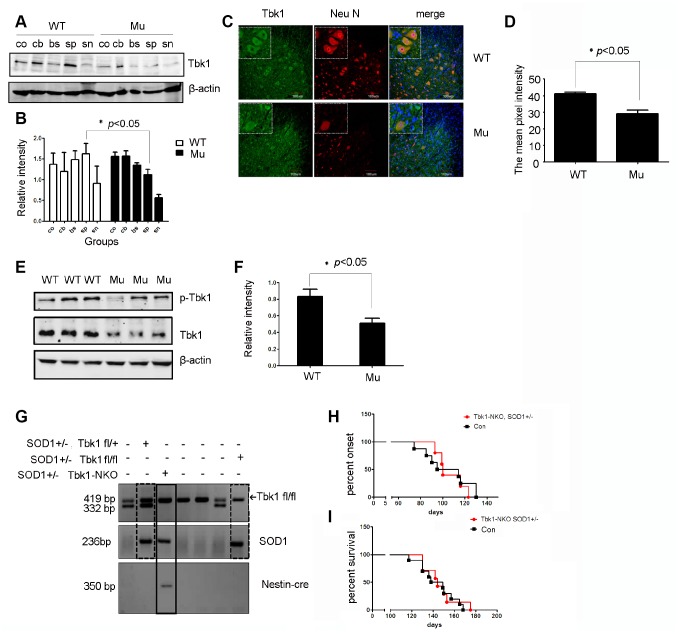
Figure 11.
Analysis of Tbk1 expression in ALS transgenic mice. (A–B) Western blot analyses of neural Tbk1 expression in SOD1G93A transgenic mice (co: cortex, cb: cerebellum, br: brain stem, sp: spinal cord, sn: sciatic nerve; n = 3); *P < 0.05, compared to WT littermates. (C–D) Tkb1 distribution in the spinal cord evaluated by confocal microscopy. Bar = 100 μm. (E–F) Western blot analysis of phosphorylated Tbk1 in the spinal cord of SOD1G93A mice; representative blot (E) and summary graph of densitometric analysis (F); (n = 3); *P < 0.05, compared to WT littermates. (G) Genotyping of Tbk1-NKO, SOD1G93A+/- mice established by crossing Tbk1-NKO mice with SOD1G93A+/- mice. (H–I) Disease symptoms onset and survival times recorded for Tbk-NKO, SOD1G93A+/- mice; no differences were observed compared with other genotypes, i.e. Tbk1fl/fl, SOD1G93A+/- mice, Tbk1fl/+, SOD1G93A+/- mice, and Nestin-cre+/-, Tbk1 fl/+, SOD1G93A+/- mice (n = 6-7).

