Figure 8.
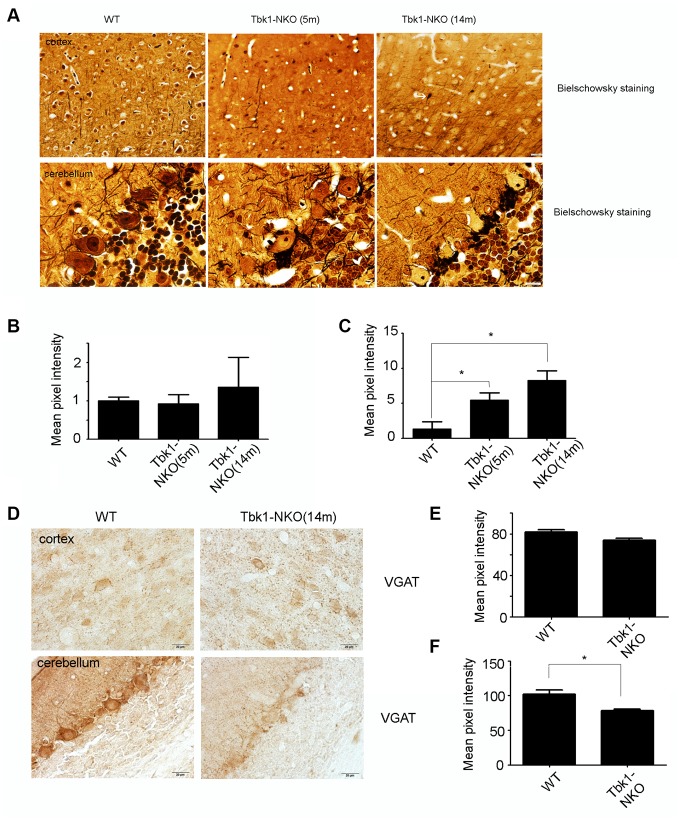
Assessment of neuropathological changes. (A) Bielschowsky staining of the cortex and cerebellum in mice aged 5 and 14 months (n = 3). A neurofibrillary tangle is indicated by a white arrow. Bar = 10 mm. (B–C) Quantification of dendritic densities (n = 3); *P < 0.05, compared to WT mice. (D) VGAT immunostaining of the cortex and cerebellum of mice at 5 and 14 months (n = 3). Bar = 10 mm. (E–F) Quantification of VGAT expression. Mean pixel intensity was analyzed using image J software (n = 3); *P < 0.05, compared to WT mice

